Working with Fragments
Loading Fragments
The generation of the proper fragment set is a key element in the outcome of some computational approaches such as ab initio.
The ability to analyse the distribution an coverage of the fragment set used in a particular experiment can translate into a better understanding of the putative challenging regions in a protein design. Fragments can be easily loaded with:
In [1]: import rstoolbox as rs
   ...: import pandas as pd
   ...: pd.set_option('display.width', 1000)
   ...: pd.set_option('display.max_columns', 500)
   ...: pd.set_option("display.max_seq_items", 3)
   ...: df3 = rs.io.parse_rosetta_fragments('../rstoolbox/tests/data/wauto.200.3mers.gz')
   ...: df9 = rs.io.parse_rosetta_fragments('../rstoolbox/tests/data/wauto.200.9mers.gz')
   ...:
Fragments Quality Measure
With fragments, one can use the FragmentFrame.add_quality_measure() method. This method will run Rosetta’s r_fraq_qual
application and measure how close each set of fragments is from the target tertiary structure. To this function we can provide the PDB file
and it will generate a file named similarly to the original fragments file name. Thus, for wauto.200.3mers.gz we will get wauto.200.3mers.qual.gz.
Warning
To generate this file, the function will run Rosetta. If Rosetta is not locally installed, one can run the r_fraq_qual application in a different
computer/cluster and put it back in the same directory. As long as the naming schema for the file is maintained, if the function finds the file it
will skip the Rosetta execution. It that case, we just need to provide None to activate the automatic behaviour.
In [2]: df3 = df3.add_quality_measure(None)
   ...: df9 = df9.add_quality_measure(None)
   ...:
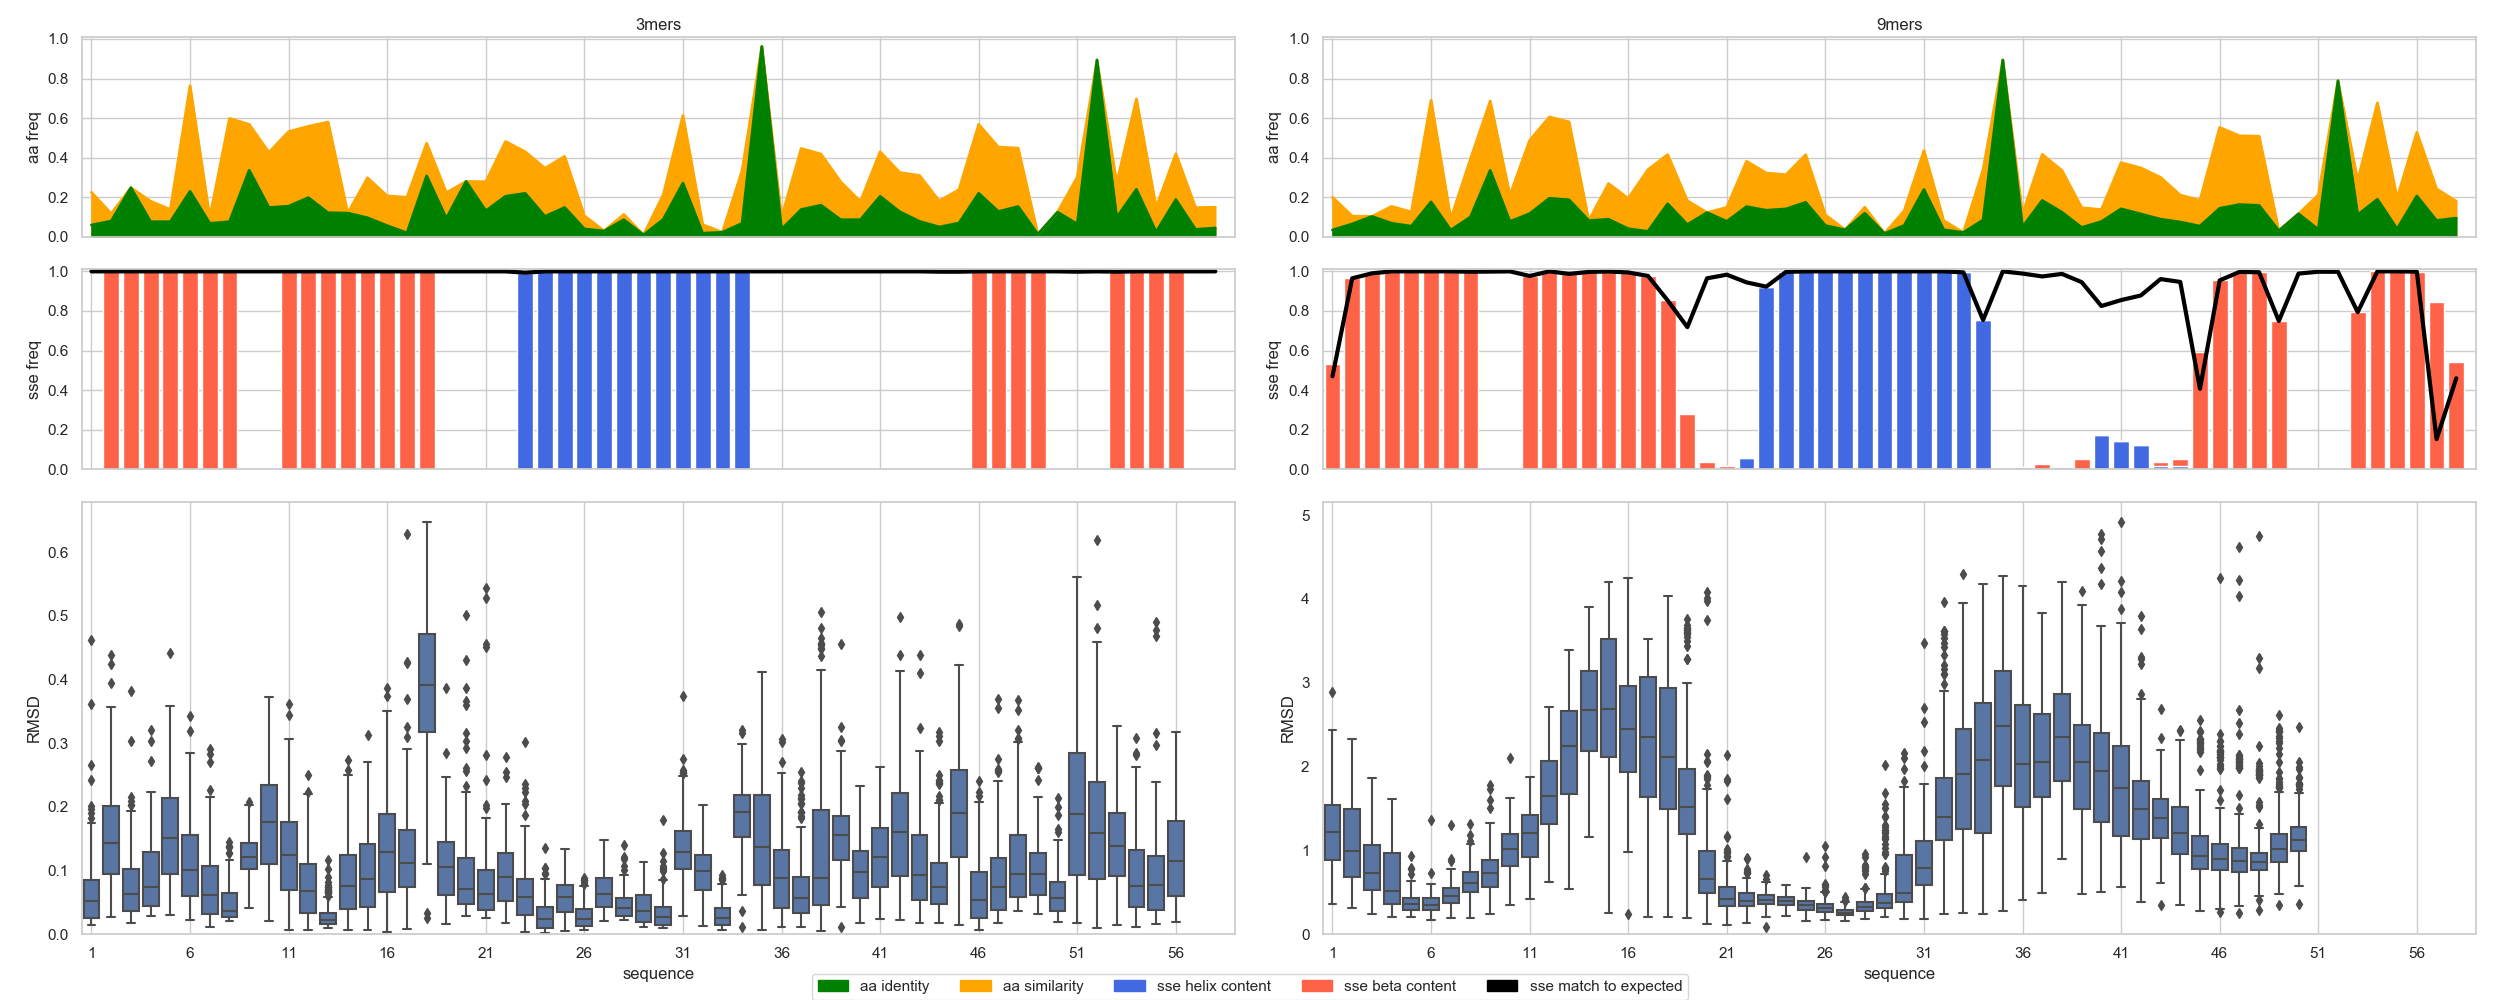
Plotting Fragments
The most complete way to view the fragment’s distribution over a given structure requires first to provide the reference_sequence and reference_structure;
with this data, one can plot_fragment_profiles()
In [3]: import matplotlib.pyplot as plt
   ...: fig = plt.figure(figsize=(25, 10))
   ...: seq = "ETPYAIALNDRVIGSSMVLPVDLEEFGAGFLFGQGYIKKAEEIREILVCPQGRISVYA"
   ...: sse = "LEEEEEEELLEEEEEEEELLLLHHHHHHHHHHHHLLLLLLLLLLLEEEELLLEEEELL"
   ...: axs = rs.plot.plot_fragment_profiles(fig, df3, df9, seq, sse)
   ...: plt.tight_layout()
   ...:

In [4]: plt.show()

In [5]: plt.close('all')