rstoolbox.plot.plot_fragment_profiles
-
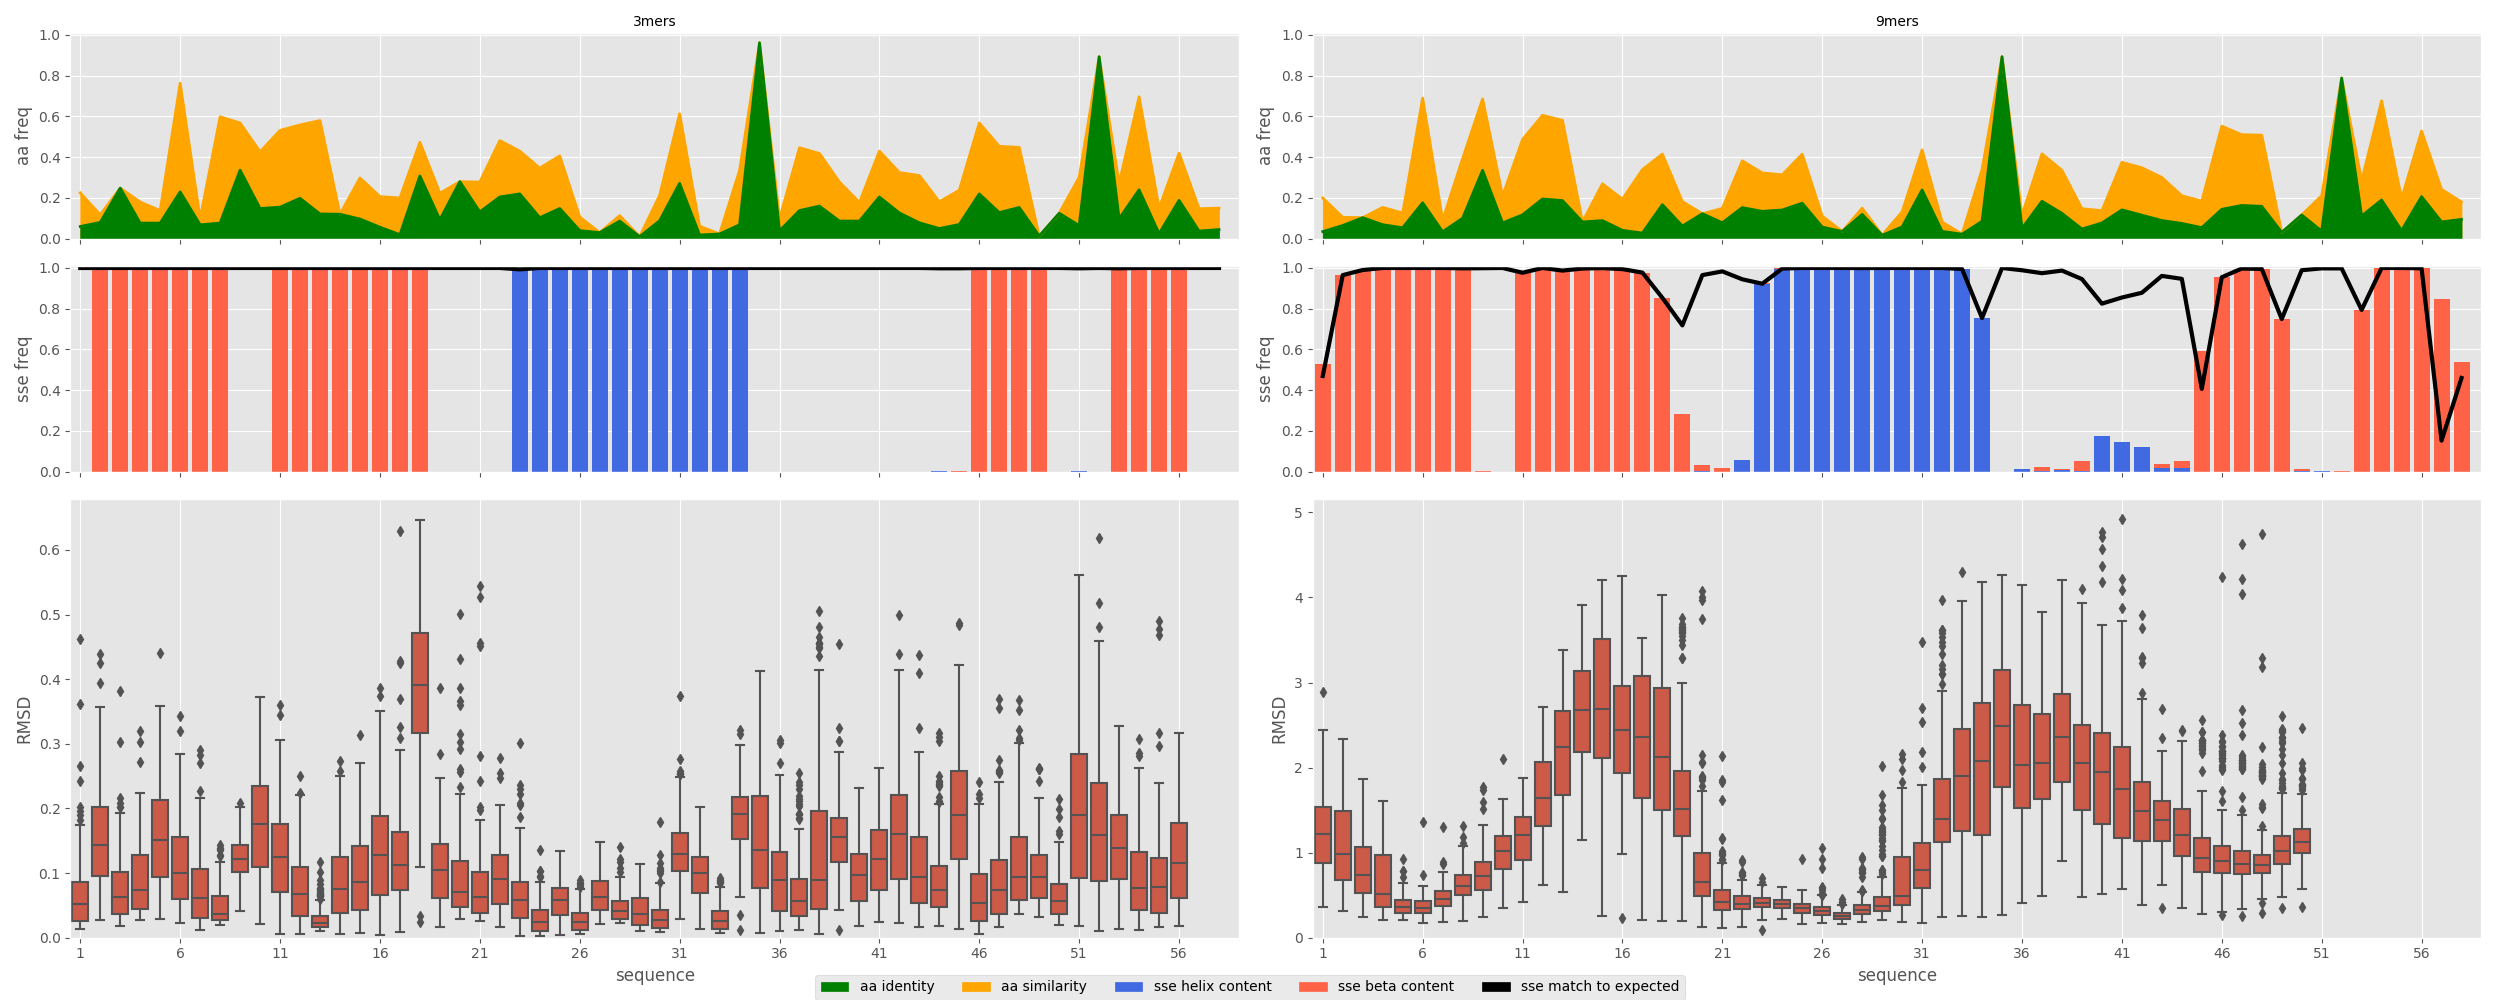
rstoolbox.plot.plot_fragment_profiles(fig, small_frags, large_frags, ref_seq, ref_sse, matrix='BLOSUM62')¶ Plots a full summary of the a
FragmentFramequality with sequence and expected secondary structure match.Parameters: - fig (
Figure) – Figure into which the data is going to be plotted. - small_frags (
FragmentFrame) – Data for the small fragments. - large_frags (
FragmentFrame) – Data for the large fragments. - ref_seq (str) – Reference sequence over which to compare.
- ref_sse (str) – Reference secondary structure over which to compare.
- matrix (str) – Sequence similarity matrix to use for calculations.
Defualt is
BLOSUM62.
Returns: list()ofAxesSee also
Example
In [1]: from rstoolbox.io import parse_rosetta_fragments
   ...: from rstoolbox.plot import plot_fragment_profiles
   ...: import matplotlib.pyplot as plt
   ...: df3 = parse_rosetta_fragments("../rstoolbox/tests/data/wauto.200.3mers.gz")
   ...: df9 = parse_rosetta_fragments("../rstoolbox/tests/data/wauto.200.9mers.gz")
   ...: df3 = df3.add_quality_measure(None)
   ...: df9 = df9.add_quality_measure(None)
   ...: fig = plt.figure(figsize=(25, 10))
   ...: seq = "ETPYAIALNDRVIGSSMVLPVDLEEFGAGFLFGQGYIKKAEEIREILVCPQGRISVYA"
   ...: sse = "LEEEEEEELLEEEEEEEELLLLHHHHHHHHHHHHLLLLLLLLLLLEEEELLLEEEELL"
   ...: axs = plot_fragment_profiles(fig, df3, df9, seq, sse)
   ...: plt.tight_layout()
   ...:

In [2]: plt.show()

In [3]: plt.close()
- fig (