rstoolbox.plot.plot_fragments
-
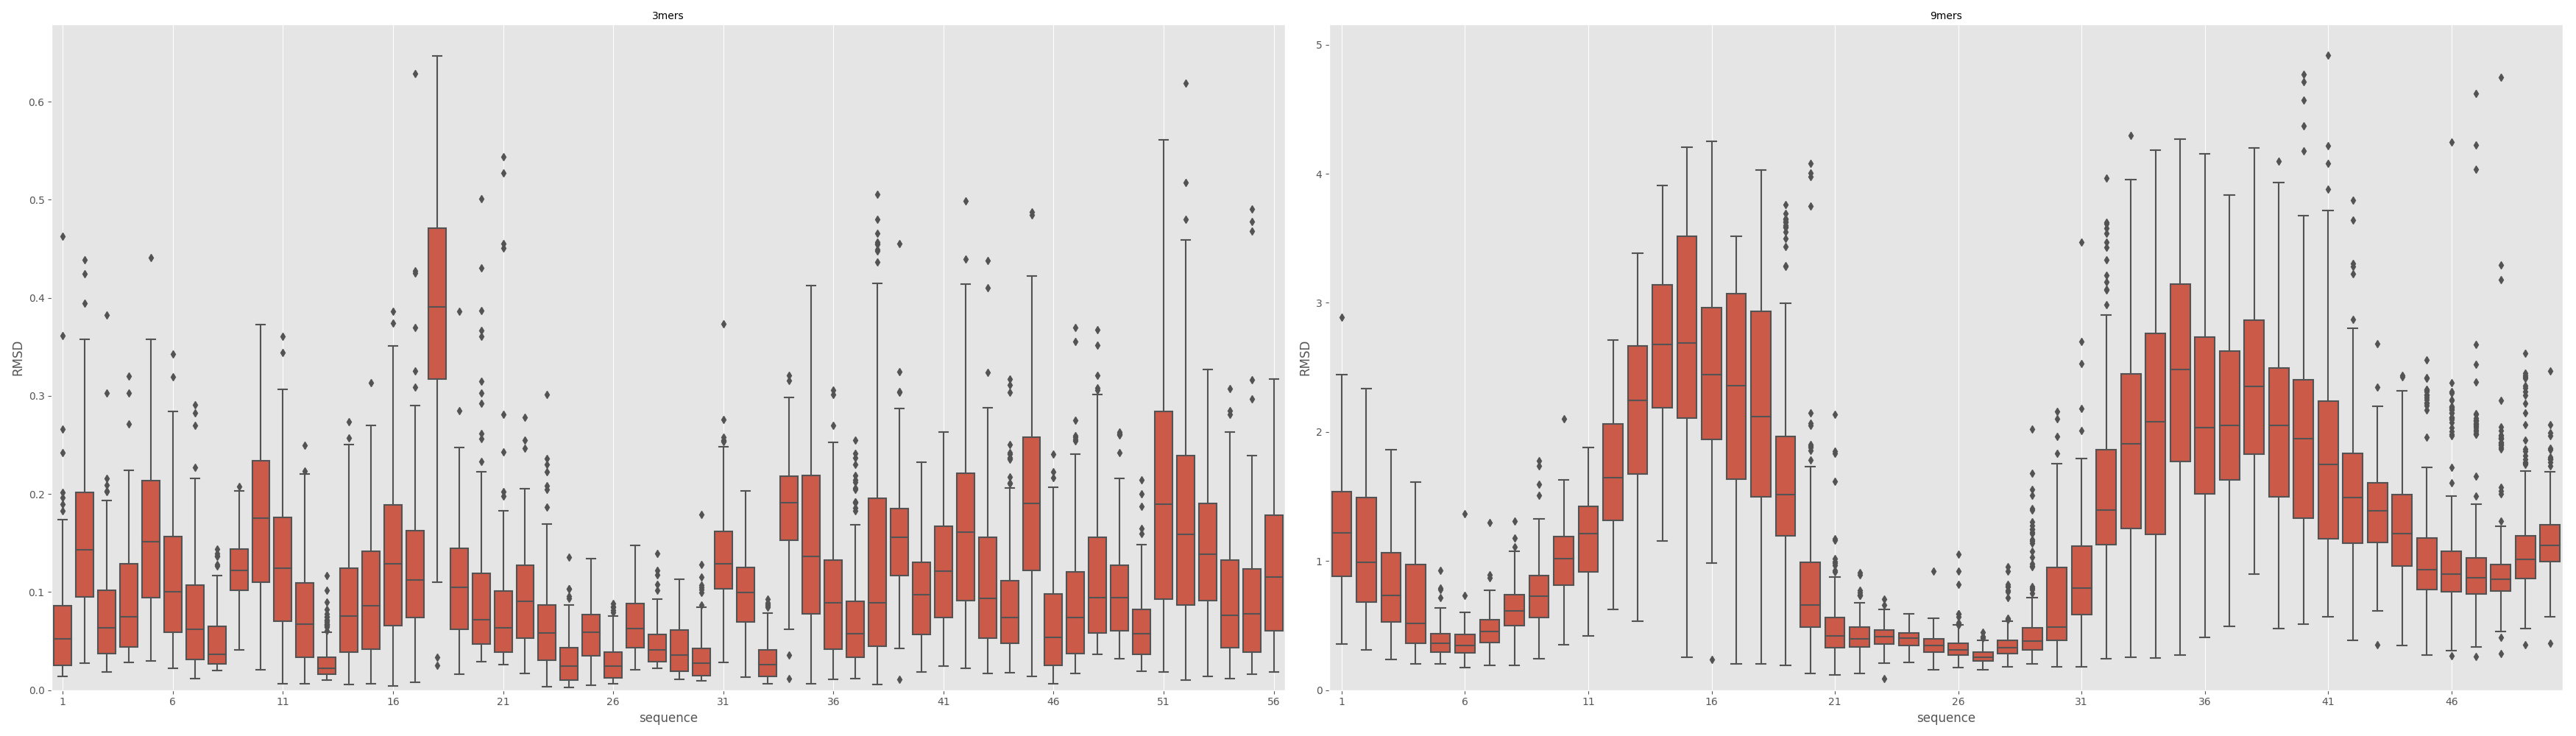
rstoolbox.plot.plot_fragments(small_frags, large_frags, small_ax, large_ax, small_color=0, large_color=0, small_max=None, large_max=None, titles='top', **kwargs)¶ Plot RMSD quality of a pair of
FragmentFramein two provided axis. Thought to more easily print both small and large fragments together.On plotting, fragment RMSD values are assigned to the first position of the fragments. This means that the plots will have a length of:
:math:`len(sequence) - len(fragment set)`
Parameters: - small_frags (
FragmentFrame) – Data for the small fragments. - large_frags (
FragmentFrame) – Data for the large fragments. - small_ax (
Axes) – Axis where to print the small fragments. - large_ax (
Axes) – Axis where to print the large fragments. - small_color (Union[
str,int]) – Color to use on the small fragments. If string, that is the assumed color. If integer, it will provide that position for the currently active color palette in seaborn. - large_color (Union[
str,int]) – Color to use on the large fragments. If string, that is the assumed color. If integer, it will provide that position for the currently active color palette in seaborn. - small_max (float) – Max value for the y (RMSD) axis of the small fragments. If not provided, the system picks it according to the given data.
- large_max (float) – Max value for the y (RMSD) axis of the large fragments. If not provided, the system picks it according to the given data.
- titles (str) – Title placement. Options are “top” or “right”. Other options will result in no titles added to the plot.
See also
Example
In [1]: from rstoolbox.io import parse_rosetta_fragments
   ...: from rstoolbox.plot import plot_fragments
   ...: import matplotlib.pyplot as plt
   ...: df3 = parse_rosetta_fragments("../rstoolbox/tests/data/wauto.200.3mers.gz")
   ...: df9 = parse_rosetta_fragments("../rstoolbox/tests/data/wauto.200.9mers.gz")
   ...: df3 = df3.add_quality_measure(None)
   ...: df9 = df9.add_quality_measure(None)
   ...: fig = plt.figure(figsize=(35, 10))
   ...: ax00 = plt.subplot2grid((1, 2), (0, 0))
   ...: ax01 = plt.subplot2grid((1, 2), (0, 1))
   ...: plot_fragments(df3, df9, ax00, ax01)
   ...: plt.tight_layout()
   ...:

In [2]: plt.show()

In [3]: plt.close()
- small_frags (