rstoolbox.plot.sequence_frequency_plot
-
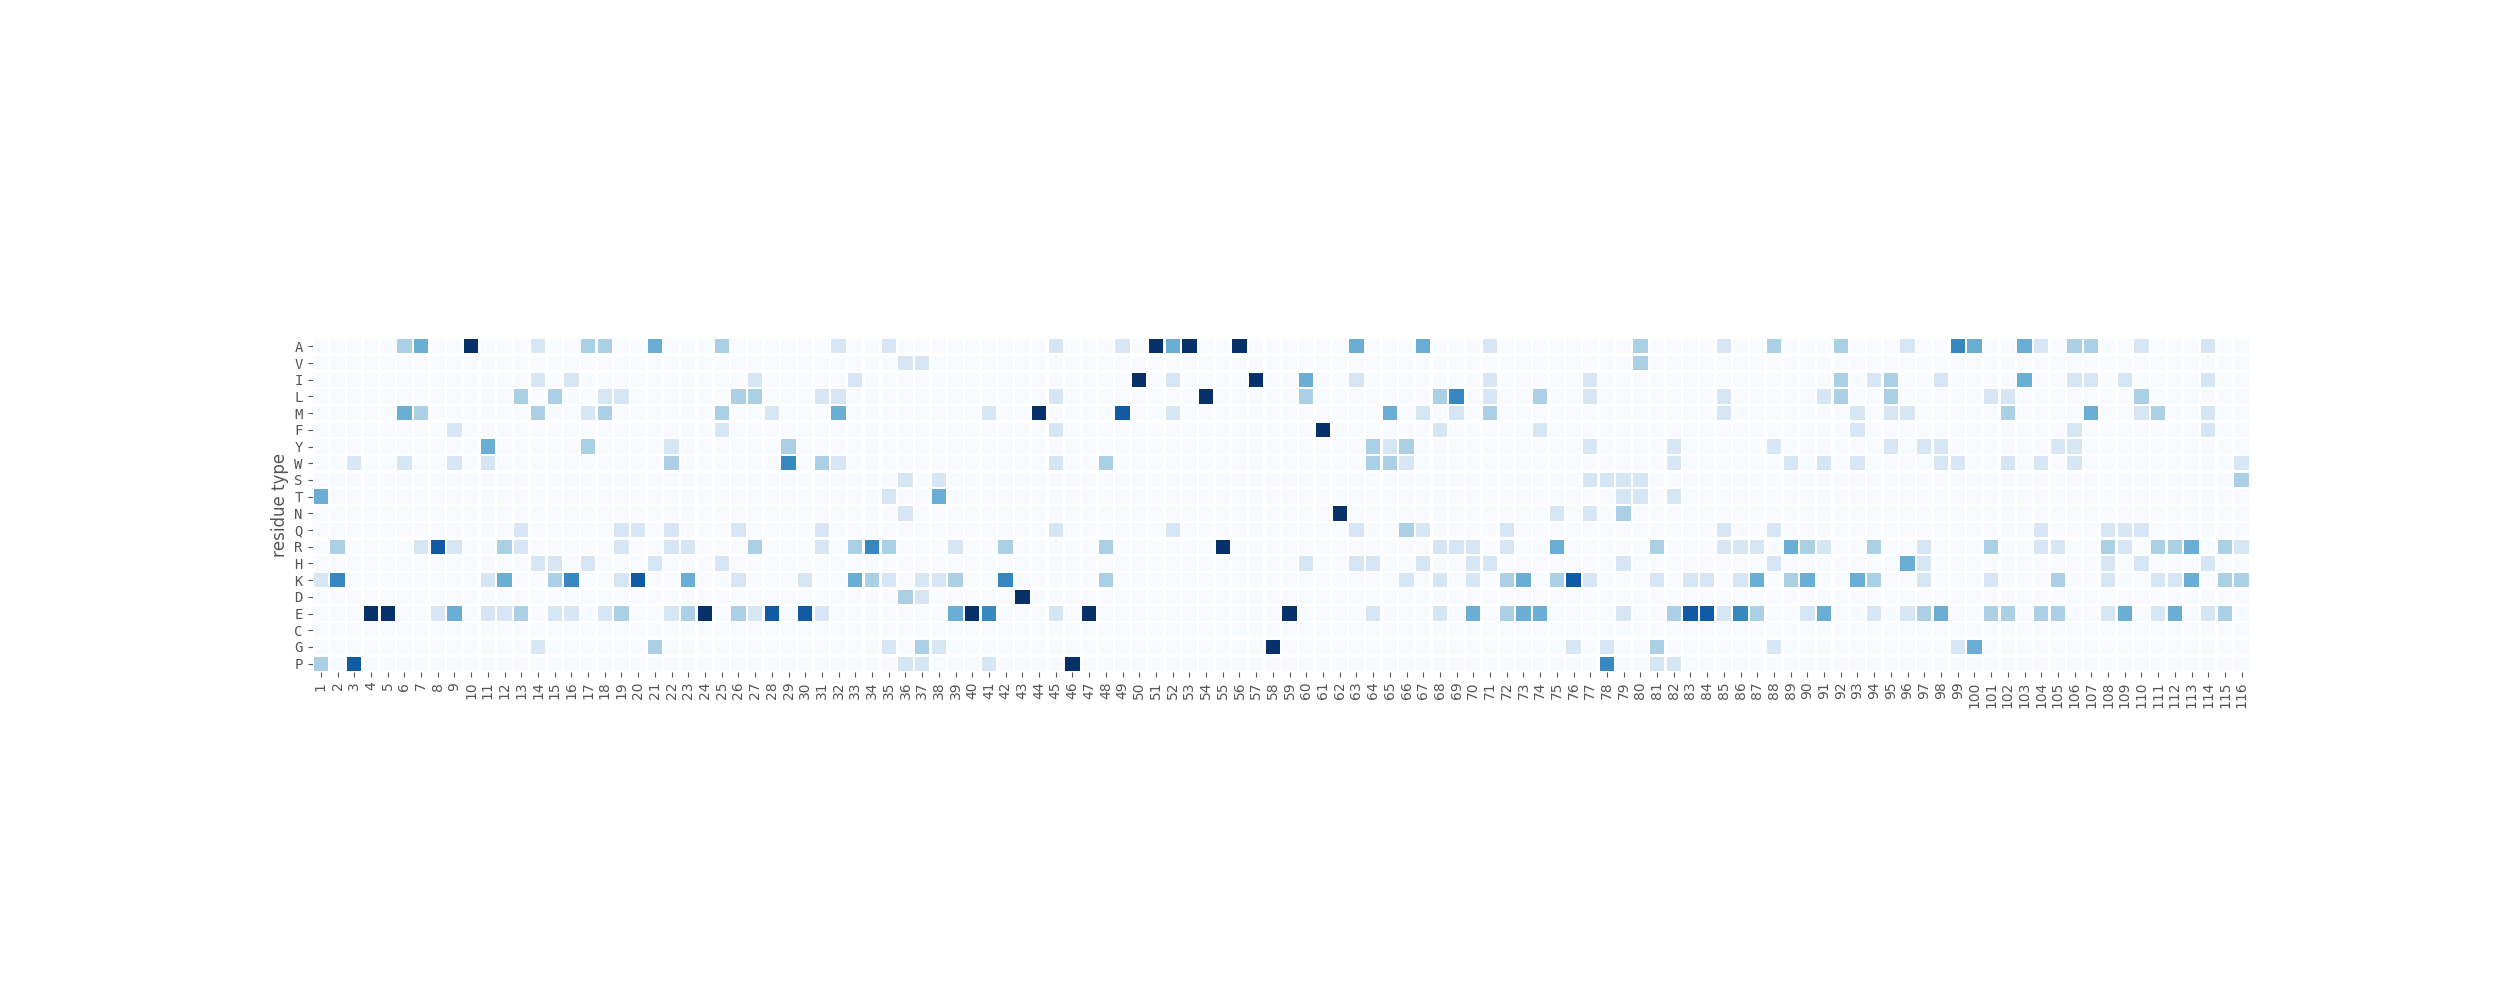
rstoolbox.plot.sequence_frequency_plot(df, seqID, ax, aminosY=True, clean_unused=-1, refseq=True, key_residues=None, border_color='green', border_width=2, labelsize=None, xrotation=0, yrotation=0, **kwargs)¶ Makes a heatmap subplot into the provided axis showing the sequence distribution of each residue type for each position.
A part from the function arguments, any argument that can be provided to the
seaborn.heatmap()function can also be provided here.By default, the heatmap generated will have the residue types as y-axis and the sequence positions as x-axis.
Some tips:
- Do you want to set the orientation of the color bar vertical? Add the parameter:
cbar_kws={"orientation": "vertical"} - Do you want to put the color bar in a different axis? This is quite recommendable, as the color bar in the same axis does not tend to look that good. Add the parameter:
cbar_ax=[second_axis] - You don’t want a color bar? Add the parameter:
cbar=False
Parameters: - df (Union[
DesignFrame,SequenceFrame]) – Data container. - seqID (str) – Identifier of the sequence of interest.
- ax (
Axes) – Where to plot the heatmap. - aminosY (bool) – Set to
Falseto get invert the orientation of the heatmap. - clean_unused (float) – Remove amino acids from the plot when they never get represented over the given frequency. Residues present in the reference sequence are not taken into account.
- refseq (rbool) – if
True(default), mark the original residues according to the reference sequence. - key_residues (Union[
int,list()ofint,str,Selection]) – Residues of interest. - border_color (Union[
int,str]) – Color to use to mark the original residue types. - border_width (int) – Line width used to mark the original residue types.
- labelsize (int) – Change the size of the text in the axis.
- xrotation (float) – Rotation to apply in the x-axis text (degrees).
- yrotation (float) – Rotation to apply in the y-axis text (degrees).
Note
Attribute
clean_unused, if applied deletes the full column/row assigned to an unrepresented residue type, this means that if that residue type is part of therefseq, it will not be labeled.Raises: ValueError: if input is not a DataFramederived object.KeyError: if there is no reference_sequencefor chainseqIDof the decoys.Example
In [1]: from rstoolbox.io import parse_rosetta_file
   ...: from rstoolbox.plot import sequence_frequency_plot
   ...: import matplotlib.pyplot as plt
   ...: df = parse_rosetta_file("../rstoolbox/tests/data/input_2seq.minisilent.gz",
   ...:                         {"sequence": "B"})
   ...: fig = plt.figure(figsize=(25, 10))
   ...: ax = plt.subplot2grid((1, 1), (0, 0))
   ...: sequence_frequency_plot(df, "B", ax, refseq=False, cbar=False, xrotation=90)
   ...:

In [2]: plt.show()

In [3]: plt.close()
- Do you want to set the orientation of the color bar vertical? Add the parameter: