rstoolbox.plot.positional_structural_similarity_plot
-
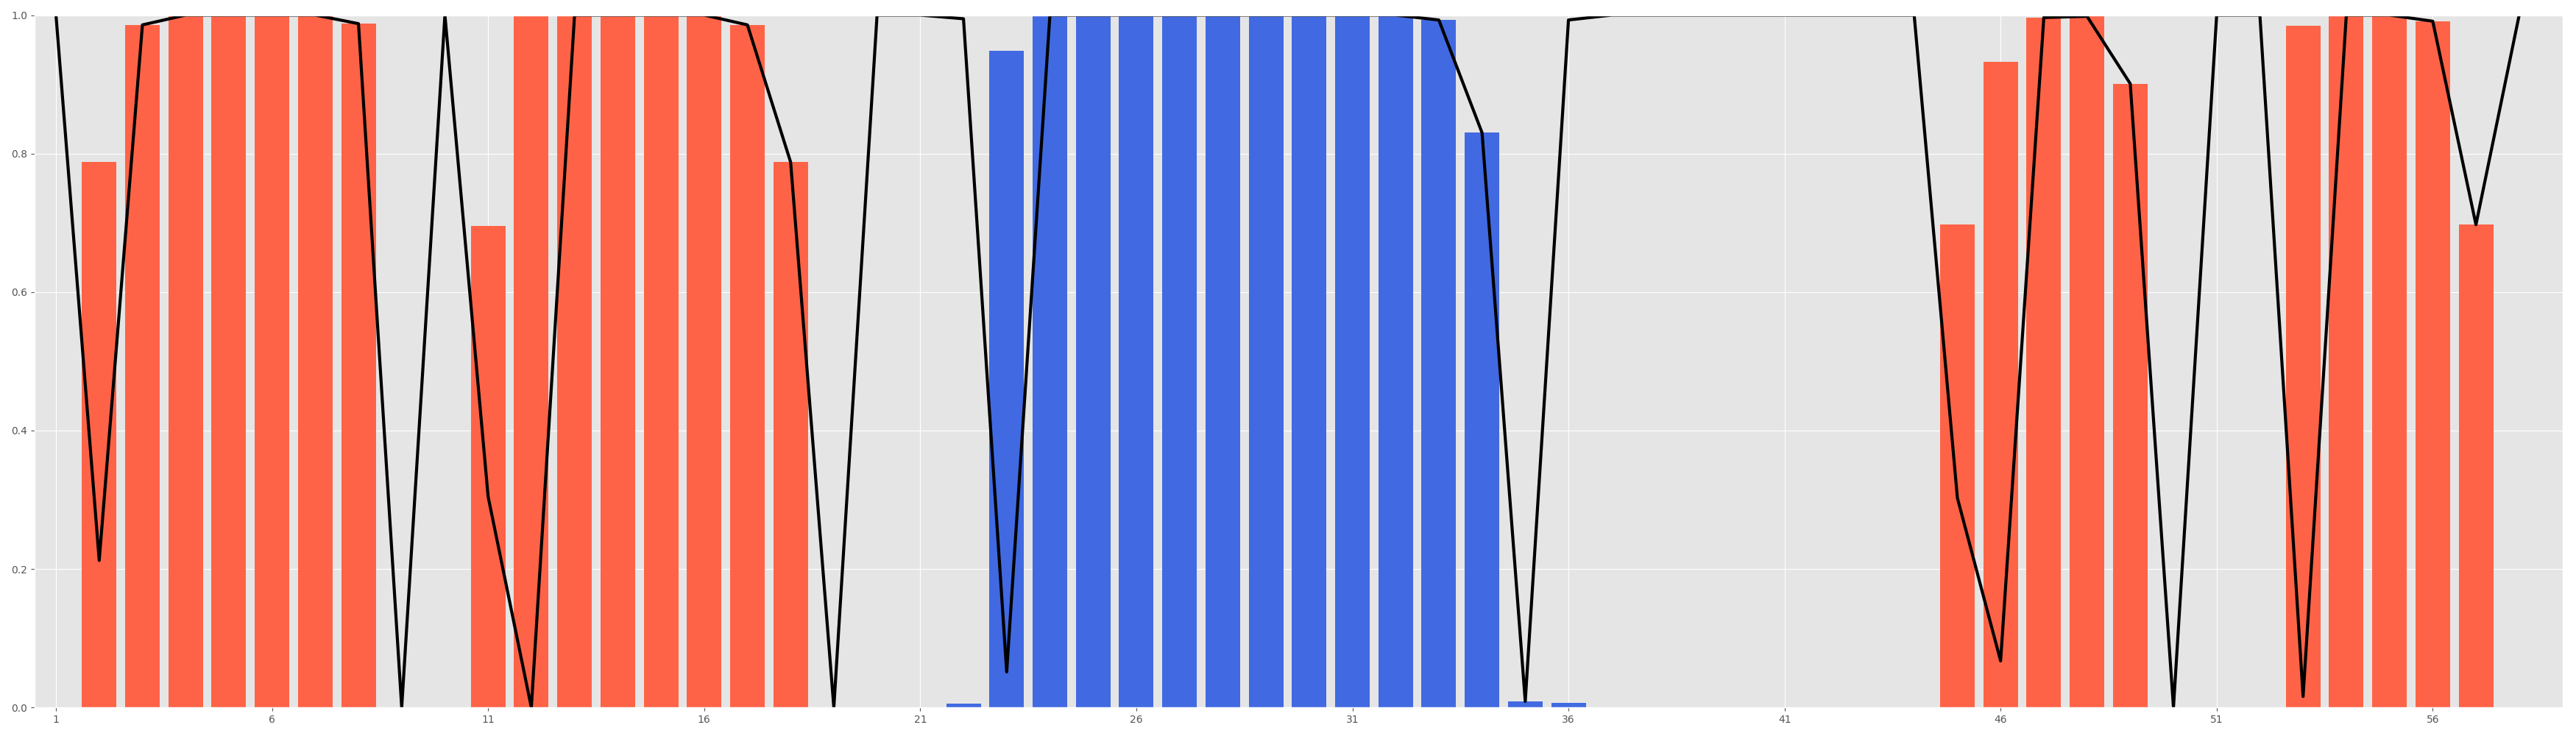
rstoolbox.plot.positional_structural_similarity_plot(df, ax, alpha_color='royalblue', beta_color='tomato', identity_color='black', identity_width=3)¶ Generates a bar plot for positional prevalence of secondary structure elements.
Input data can/should be generated with
positional_structural_count().If there is a
identity_perccolumn present, which can be obtained by runningpositional_structural_identity(), it will also print a line showing how often the secondary structure matches the expected/reference one.Both
DataFrameobtained through the two functions can be simply merged with:pd.concat([df1, df2], axis=1)
Parameters: - df (
DataFrame) – Data container, where rows are sequence positions and columns represent the secondary structure type:H,EandL - ax (
Axes) –matplotlibaxis to which we will plot. - alpha_color (Union[
int,str]) – Color to represent helices. - beta_color (Union[
int,str]) – Color to represent beta strands. - identity_color (Union[
int,str]) – Color to represent the secondary structure identity with the expectedreference_structure. - identity_width (int) – Width of the line representing the
identity with the expected
reference_structure.
Example
In [1]: from rstoolbox.io import parse_rosetta_file
   ...: from rstoolbox.analysis import positional_structural_count
   ...: from rstoolbox.analysis import positional_structural_identity
   ...: from rstoolbox.plot import positional_structural_similarity_plot
   ...: import pandas as pd
   ...: pd.set_option('display.width', 1000)
   ...: pd.set_option('display.max_columns', 500)
   ...: df = parse_rosetta_file("../rstoolbox/tests/data/input_ssebig.minisilent.gz",
   ...:                         {'scores': ['score'], 'structure': 'C'})
   ...: df.add_reference_structure('C', df.get_structure('C').values[0])
   ...: df1 = positional_structural_identity(df.iloc[1:], 'C')
   ...: df2 = positional_structural_count(df.iloc[1:], 'C')
   ...: fig = plt.figure(figsize=(35, 10))
   ...: ax00 = plt.subplot2grid((1, 1), (0, 0))
   ...: positional_structural_similarity_plot(pd.concat([df1, df2], axis=1), ax00)
   ...: plt.tight_layout()
   ...:

In [2]: plt.show()

In [3]: plt.close()
- df (