rstoolbox.plot.plot_thermal_melt
-
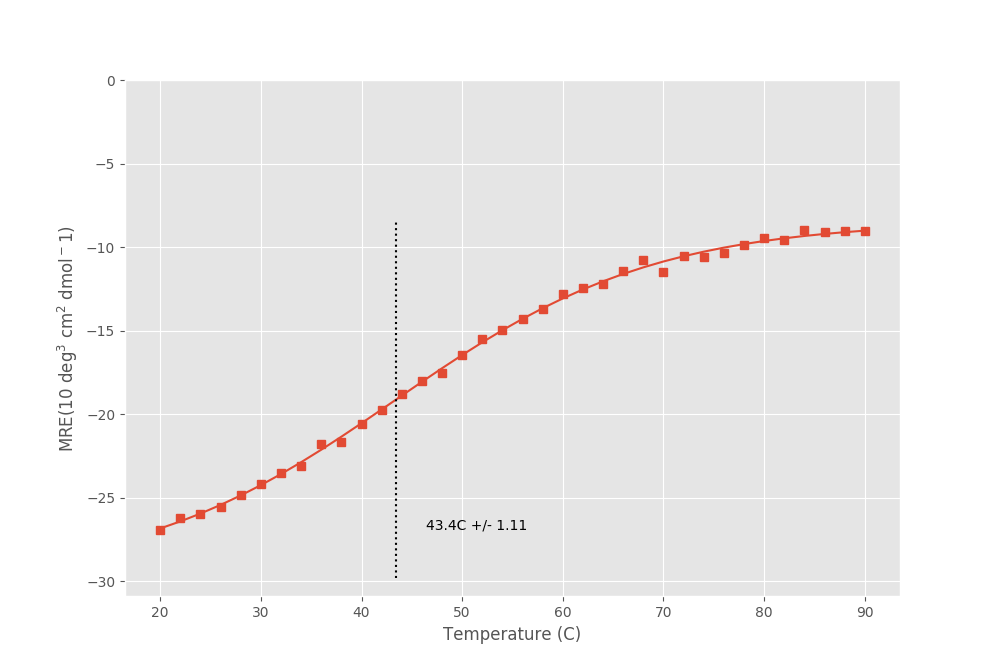
rstoolbox.plot.plot_thermal_melt(df, ax, linecolor=0, pointcolor=0, min_temperature=None, fusion_temperature=False, temp_marker=False)¶ Plot Thermal Melt data.
Plot thermal melt and generate the fitting curve to the pointsself.
The provied
DataFramemust contain, at least, the following columns:Column Name Data Content Temp Temperatures (celsius). MRE Value at each temperature (10 deg^2 cm^2 dmol^-1). Warning
Some of the advanced attributes in this function require
scipyto be installed.Parameters: - df (
DataFrame) – Data container. - ax (
Axes) – Axis in which to plot the data. - linecolor (Union[
int,str]) – Color for the fitting line. If a number, it takes from the currentseabornpalette. - pointcolor (Union[
int,str]) – Color for the points. If a number, it takes from the currentseabornpalette. - min_temperature (float) – If provided, set minimum temperature in the Y axis of the plot.
- fusion_temperature (bool) – When
True, calculates the fusion temperature when possible. Requires ``scipy`` library. - temp_marker (bool) – When
True, approximate and annotate the expected melting point. requires ``scipy`` library.
Example
In [1]: from rstoolbox.plot import plot_thermal_melt
   ...: import numpy as np
   ...: import pandas as pd
   ...: import matplotlib.pyplot as plt
   ...: df = pd.read_csv("../rstoolbox/tests/data/thermal_melt.csv")
   ...: fig = plt.figure(figsize=(10, 6.7))
   ...: ax = plt.subplot2grid((1, 1), (0, 0))
   ...: plot_thermal_melt(df, ax, fusion_temperature=True, temp_marker=True)
   ...:

In [2]: plt.show()

In [3]: plt.close()
- df (