rstoolbox.plot.plot_ramachandran
-
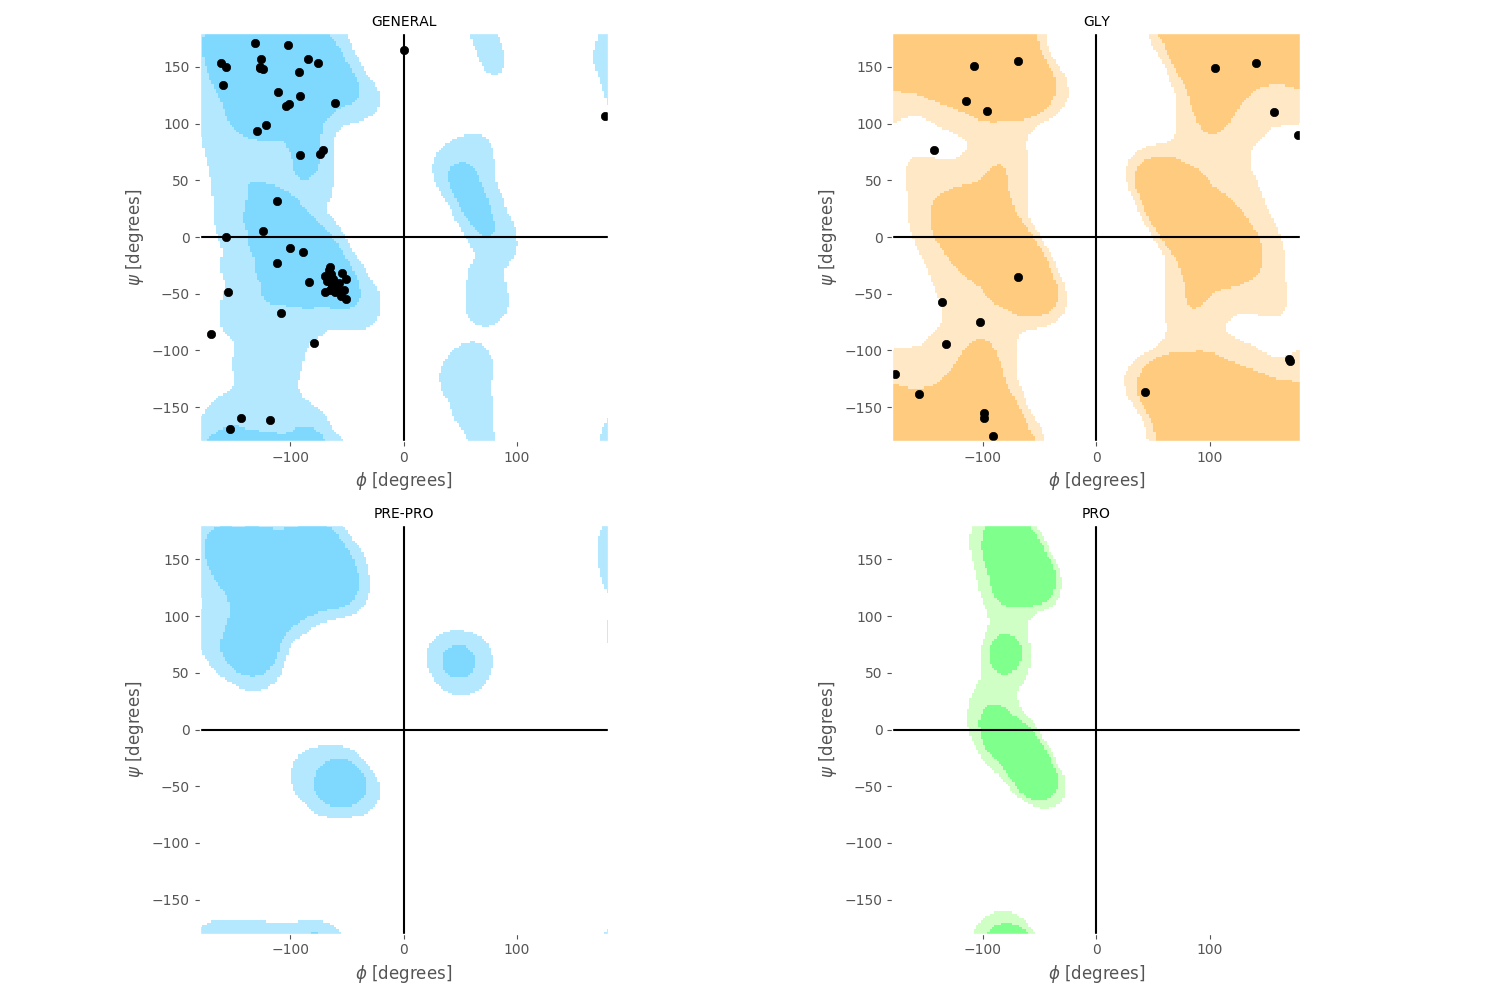
rstoolbox.plot.plot_ramachandran(df, seqID, fig, grid=None, positions=None, **kwargs)¶ Generates a ramachandran plot in RAMPAGE style.
For more details and sources please refert to ramachandran plot for python
Background distribution data taken from git repository
The phi - psi dihedrals should be present in the DesignSerie. If this is not the case, consider computing them using for example the
get_sequence_and_structure(). Note that this function will only plot the ramachandran for a single decoy. If one would like to compute it for mutiple decoys, please see the example below.Parameters for
scatter()can be provided with prefixscatter_.Parameters for
plot()can be provided with prefixline_.Parameters: - df (
Series) – Data container, where ONE column cotains the phi and a second column the psi angles. - seqID (str) – Identifier of the sequence of interest
- fig (
Figure) – Figure into which the data is going to be plotted. - grid (tuple) – Grid of the figure. By default assumes the figure has nothing else and so, the grid is (2, 2).
- positions (
list()oftuple) – Positions in the grid (in case the image will contain more than the Ramachandran). By default, it assumes a (2, 2) grid and fills all positions.
Returns: list()ofAxesRaises: ValueError: If the grid does not provide at least 4 positions. ValueError: If there number of positions is not 4. See also
plot_ramachandran_single()get_sequence_and_structure()get_dihedrals()get_phi()get_psi()Example
In [1]: import rstoolbox as rb
   ...: import pandas as pd
   ...: plt.style.use('ggplot')
   ...: definitions = {
   ...:                "scores": ["score"],
   ...:                "sequence" : "A",
   ...:                "psipred" : "*",
   ...:                "structure" : "*",
   ...:                "dihedrals": "*"
   ...:                }
   ...: dsf = rb.io.parse_rosetta_file(
   ...:     "../rstoolbox/tests/data/input_3ssepred.minisilent.gz",
   ...:     definitions )
   ...: figure = plt.figure(figsize=(15,10))
   ...: rb.plot.plot_ramachandran(dsf.iloc[0], "A", figure)
   ...: plt.tight_layout()
   ...: fig.subplots_adjust(top=1.2)
   ...:

In [2]: plt.show()

In [3]: plt.close()
- df (