rstoolbox.plot.plot_dssp_vs_psipred
-
rstoolbox.plot.plot_dssp_vs_psipred(df, seqID, ax)¶ Generates a horizontal heatmap showing differences in psipred predictions to dssp assignments.
The dssp and psipred strings should be present in the DesignSerie. If not the case, consider computing them using for example the
get_sequence_and_structure(). Note that this function will only plot the heatmap for a single decoy. If more are requested, please see the example below.Parameters: return:
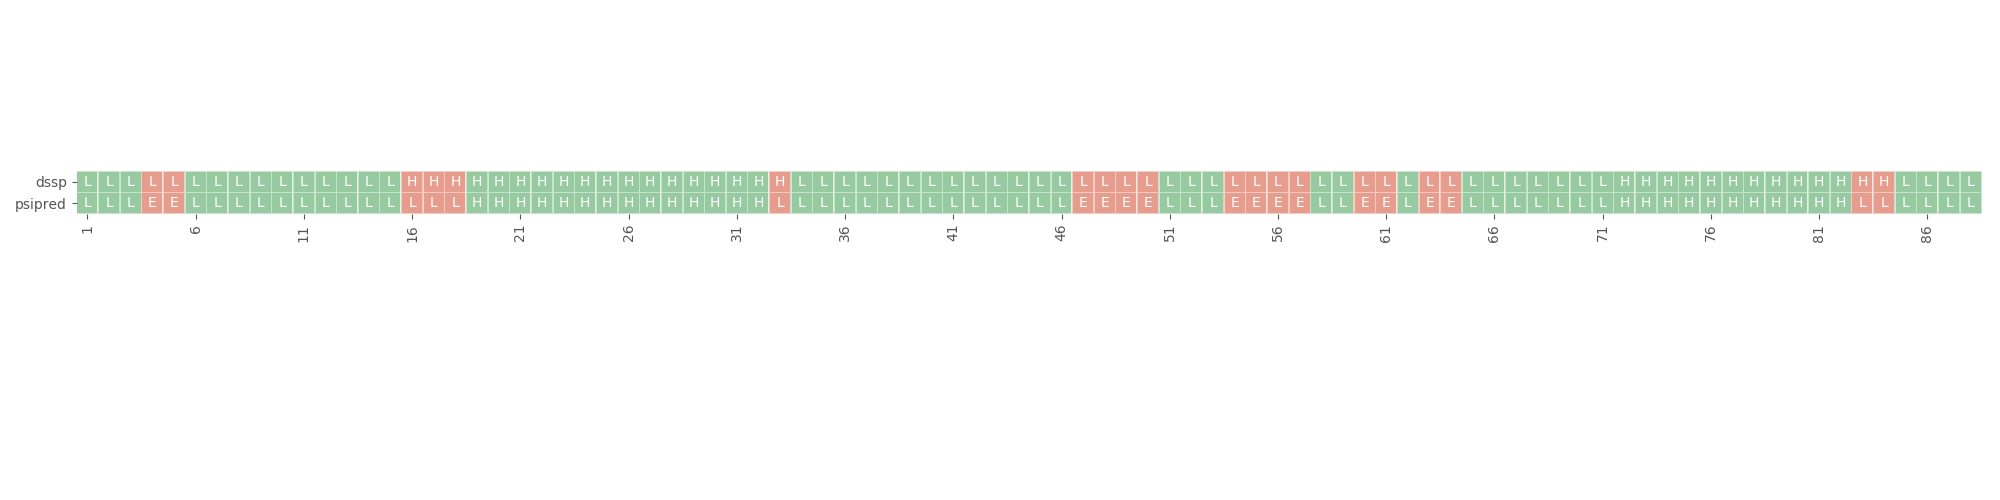
list()ofAxesExample1
In [1]: import rstoolbox as rb
   ...: import pandas as pd
   ...: plt.style.use('ggplot')
   ...: fig = plt.figure(figsize=(20, 5))
   ...: definitions = {
   ...:                "scores": ["score"],
   ...:                "sequence": "A",
   ...:                "psipred": "*",
   ...:                "structure": "*",
   ...:                "dihedrals": "*"
   ...:                }
   ...: dsf = rb.io.parse_rosetta_file(
   ...:     "../rstoolbox/tests/data/input_3ssepred.minisilent.gz",
   ...:     definitions )
   ...: ax = plt.gca()
   ...: rb.plot.plot_dssp_vs_psipred(dsf.iloc[0], "A", ax)
   ...: plt.tight_layout()
   ...: fig.subplots_adjust(top=1.2)
   ...:

In [2]: plt.show()
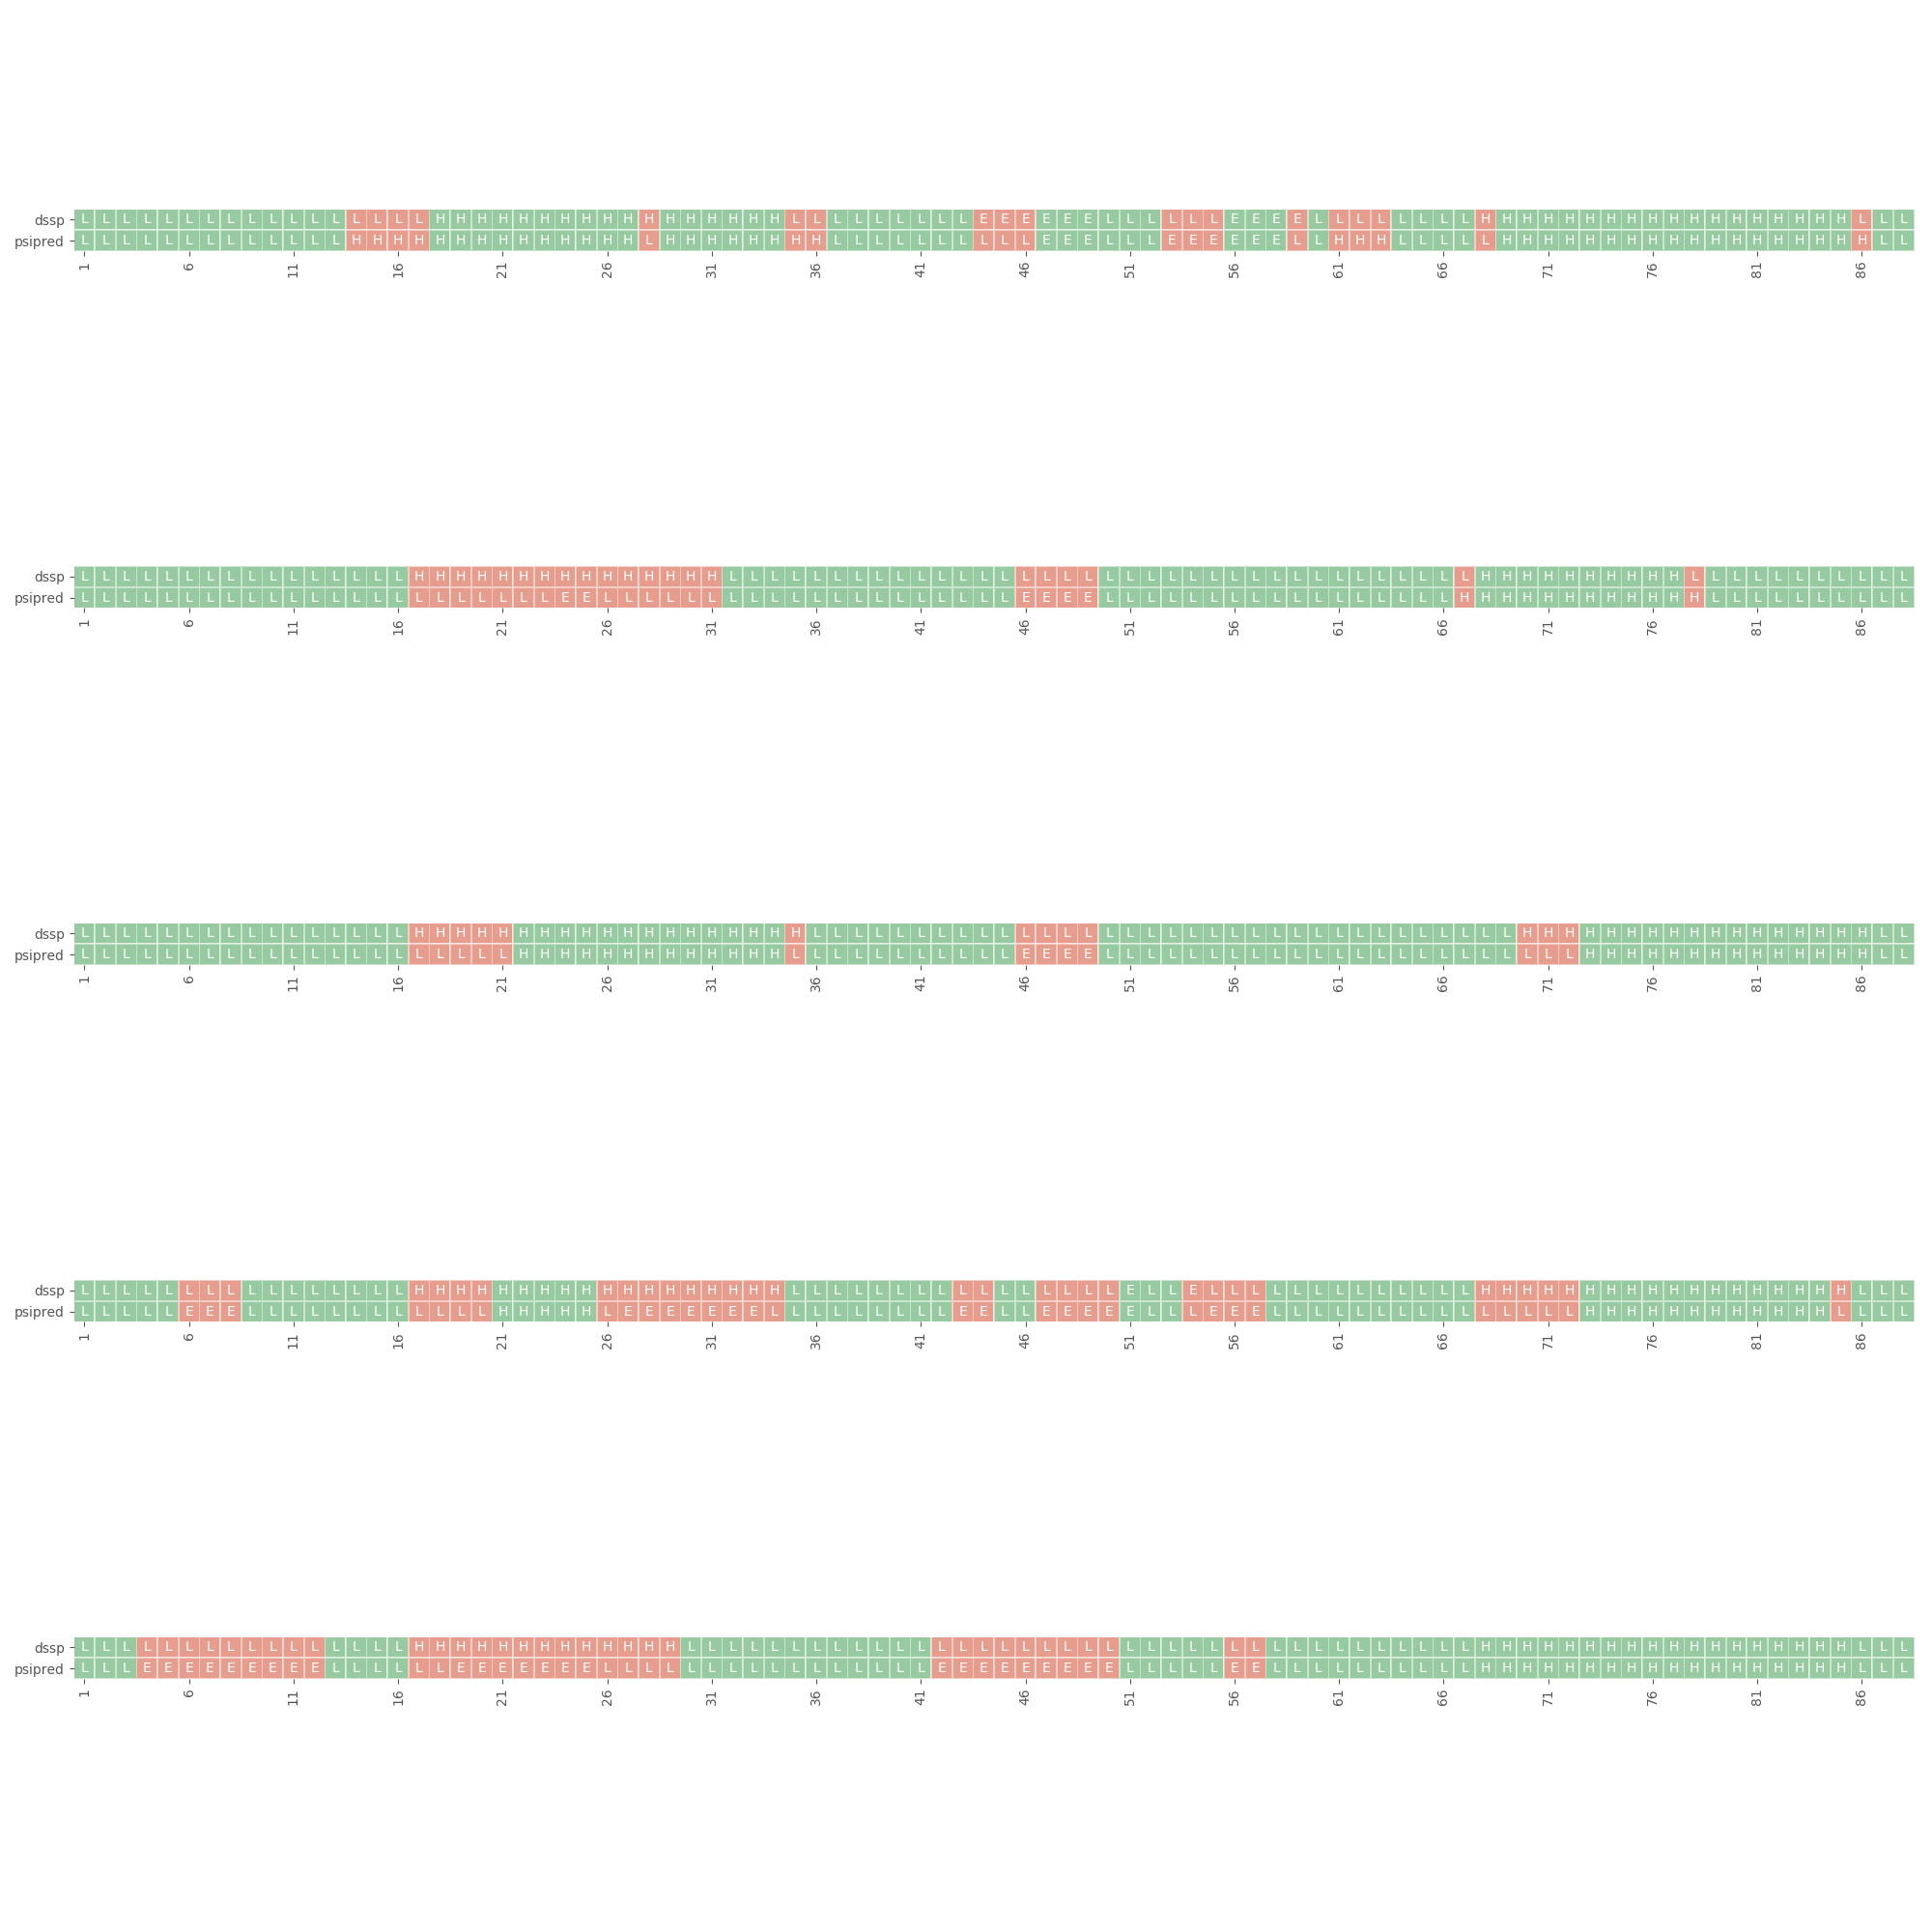
Example2
In [3]: import rstoolbox as rb
   ...: import pandas as pd
   ...: plt.style.use('ggplot')
   ...: fig = plt.figure(figsize=(20, 20))
   ...: definitions = {
   ...:                "scores": ["score"],
   ...:                "sequence": "A",
   ...:                "psipred": "*",
   ...:                "structure": "*",
   ...:                "dihedrals": "*"
   ...:                }
   ...: dsf = rb.io.parse_rosetta_file(
   ...:     "../rstoolbox/tests/data/input_3ssepred.minisilent.gz",
   ...:     definitions )
   ...: for i in range(len(dsf)):
   ...:     ax = fig.add_subplot(6, 1, i+1)
   ...:     rb.plot.plot_dssp_vs_psipred( dsf.iloc[i], "A", ax )
   ...: plt.tight_layout()
   ...: fig.subplots_adjust(top=1.2)
   ...:

In [4]: plt.show()

In [5]: plt.close('all')