rstoolbox.plot.plot_SPR
-
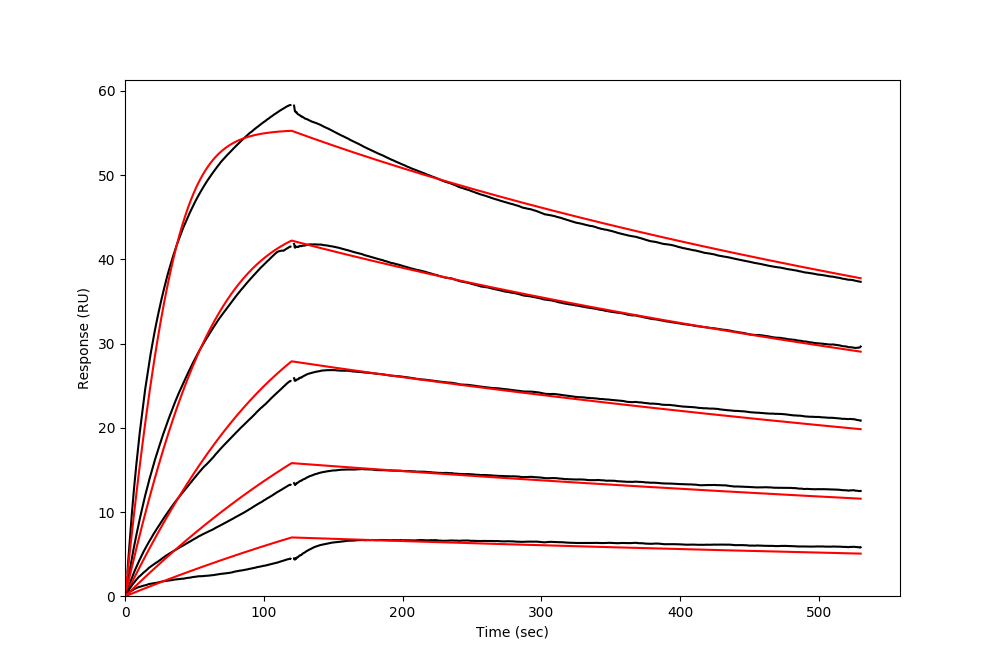
rstoolbox.plot.plot_SPR(df, ax, datacolor=0, fitcolor=0, max_time=None, max_response=None)¶ Plot Surface Plasmon Resonance data.
Plots SPR data as read by
read_SPR(). Only plots those concentrations for which a correspondingfitting curveexists.Parameters: - df (
DataFrame) – Data container. - ax (
Axes) – Axis in which to plot the data. - datacolor (Union[
int,str]) – Color for the raw data. If a number, it takes from the currentseabornpalette. - fitcolor (Union[
int,str]) – Color for the fitted data. If a number, it takes from the currentseabornpalette. - max_time (float) – If provided, set maximum time in the X axis of the plot.
- max_response (float) – If provided, set maximum RU in the Y axis of the plot.
See also
Example
In [1]: from rstoolbox.io import read_SPR
   ...: from rstoolbox.plot import plot_SPR
   ...: import pandas as pd
   ...: pd.set_option('display.width', 1000)
   ...: pd.set_option('display.max_columns', 500)
   ...: df = read_SPR("../rstoolbox/tests/data/spr_data.csv.gz")
   ...: fig = plt.figure(figsize=(10, 6.7))
   ...: ax = plt.subplot2grid((1, 1), (0, 0))
   ...: plot_SPR(df, ax, datacolor='black', fitcolor='red')
   ...:

In [2]: plt.show()

In [3]: plt.close()
- df (