rstoolbox.plot.plot_MALS
-
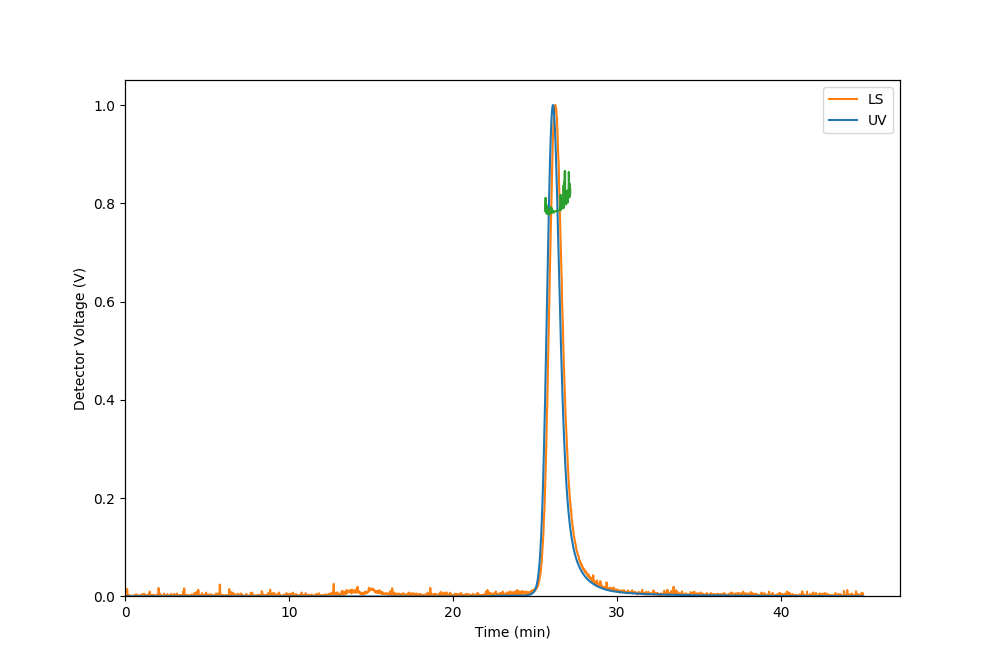
rstoolbox.plot.plot_MALS(df, ax, uvcolor=0, lscolor=1, mwcolor=2, max_voltage=None, max_time=None)¶ Plot Multi-Angle Light Scattering data.
The provied
DataFramemust contain, at least, the following columns:Column Name Data Content Time Time (min). UV UV data (V). LS Light Scattering data (V). MW Molecular Weight (Daltons). Parameters: - df (
DataFrame) – Data container. - ax (
Axes) – Axis in which to plot the data. - uvcolor (Union[
int,str]) – Color for the UV data. If a number, it takes from the currentseabornpalette. IfFalse, UV data is not plotted. - lscolor (Union[
int,str]) – Color for the LS data. If a number, it takes from the currentseabornpalette. IfFalse, LS data is not plotted. - mwcolor (Union[
int,str]) – Color for the MW data. If a number, it takes from the currentseabornpalette. IfFalse, MW data is not plotted. - max_voltage (float) – If provided, set maximum voltage in the Y axis of the plot.
- max_time (float) – If provided, set maximum time in the X axis of the plot.
Example
In [1]: from rstoolbox.plot import plot_MALS
   ...: import numpy as np
   ...: import pandas as pd
   ...: import matplotlib.pyplot as plt
   ...: df = pd.read_csv("../rstoolbox/tests/data/mals.csv")
   ...: fig = plt.figure(figsize=(10, 6.7))
   ...: ax = plt.subplot2grid((1, 1), (0, 0))
   ...: plot_MALS(df, ax)
   ...:

In [2]: plt.show()

In [3]: plt.close()
- df (