rstoolbox.plot.per_residue_matrix_score_plot
-
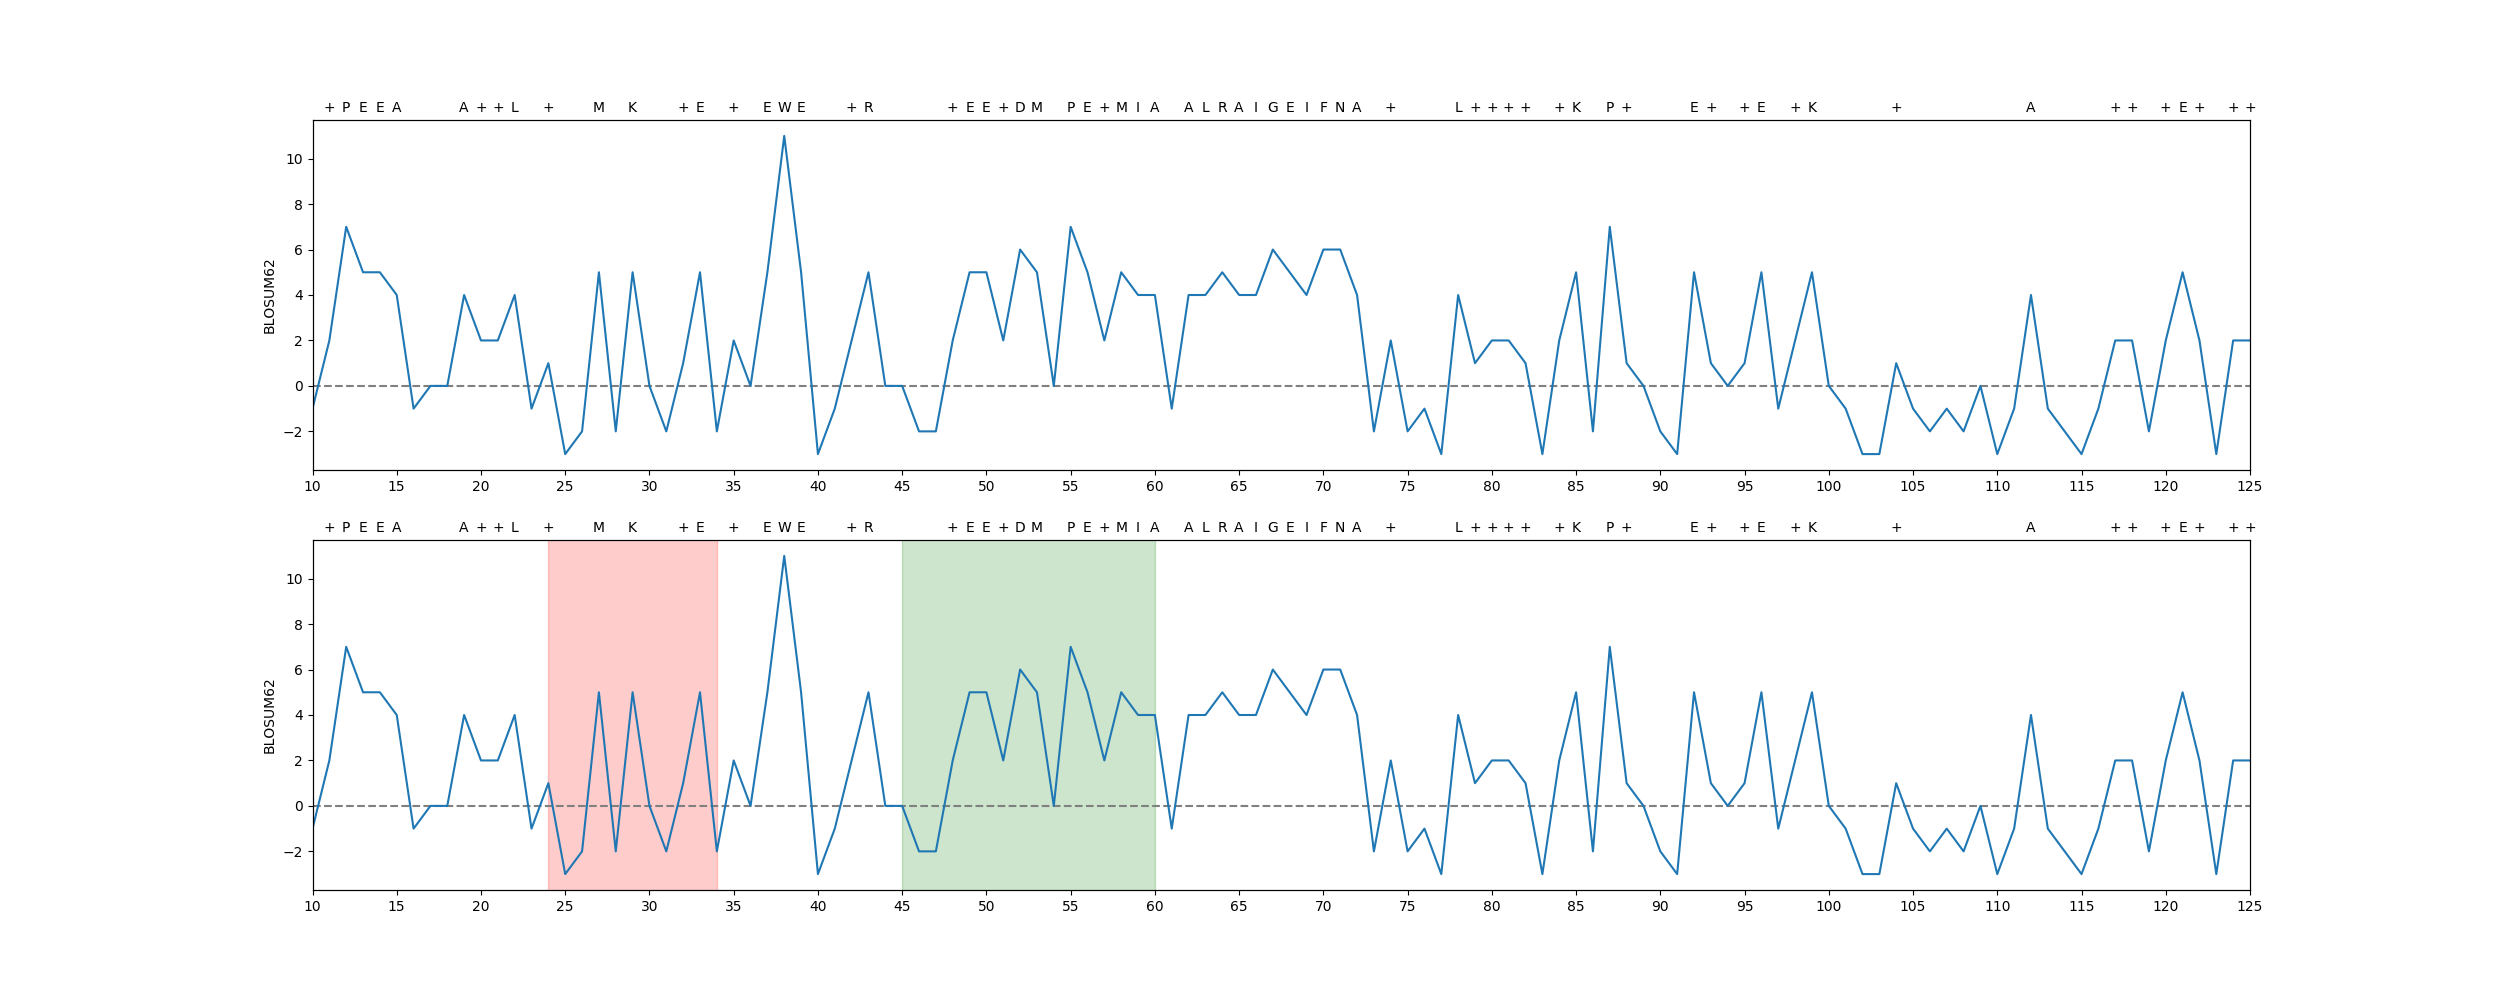
rstoolbox.plot.per_residue_matrix_score_plot(df, seqID, ax, matrix='BLOSUM62', selections=None, add_alignment=True, **kwargs)¶ Plot a linear representation of the scoring obtained by applying a substitution matrix.
Applies to a single decoy against the
reference_sequence.Parameters to control the properties of the plotted line (
color,linestyle…) can be provided too.Parameters: - df (
DesignSeries) – Data container - seqID (str) – Identifier of the sequence of interest
- ax (
Axes) – matplotlib axis to which we will plot. - matrix (str) – Identifier of the matrix used to evaluate similarity
- selections (
list()oftuplewith Union[int,list()ofint,str,Selection] and a color (strorint)) – List of regions to highlight; each position should be a selector and a color. - add_alignment (bool) – When
True, show the alignment summary in the top axis.
Raises: ValueError: If the data container is not DesignSeriesor it does not have areference_sequence.Example
In [1]: from rstoolbox.io import parse_rosetta_file
   ...: from rstoolbox.plot import per_residue_matrix_score_plot
   ...: import matplotlib.pyplot as plt
   ...: df = parse_rosetta_file("../rstoolbox/tests/data/input_2seq.minisilent.gz",
   ...:                         {"sequence": "B"})
   ...: df.add_reference_sequence('B', df.iloc[0]['sequence_B'])
   ...: df.add_reference_shift('B', 10)
   ...: seles = [('15-25', 'red'), ('45B-60B', 'green')]
   ...: fig = plt.figure(figsize=(25, 10))
   ...: ax0 = plt.subplot2grid((2, 1), (0, 0))
   ...: per_residue_matrix_score_plot(df.iloc[1], "B", ax0)
   ...: ax1 = plt.subplot2grid((2, 1), (1, 0))
   ...: per_residue_matrix_score_plot(df.iloc[1], "B", ax1, selections=seles)
   ...:

In [2]: plt.show()

In [3]: plt.close()
- df (