rstoolbox.plot.logo_plot
-
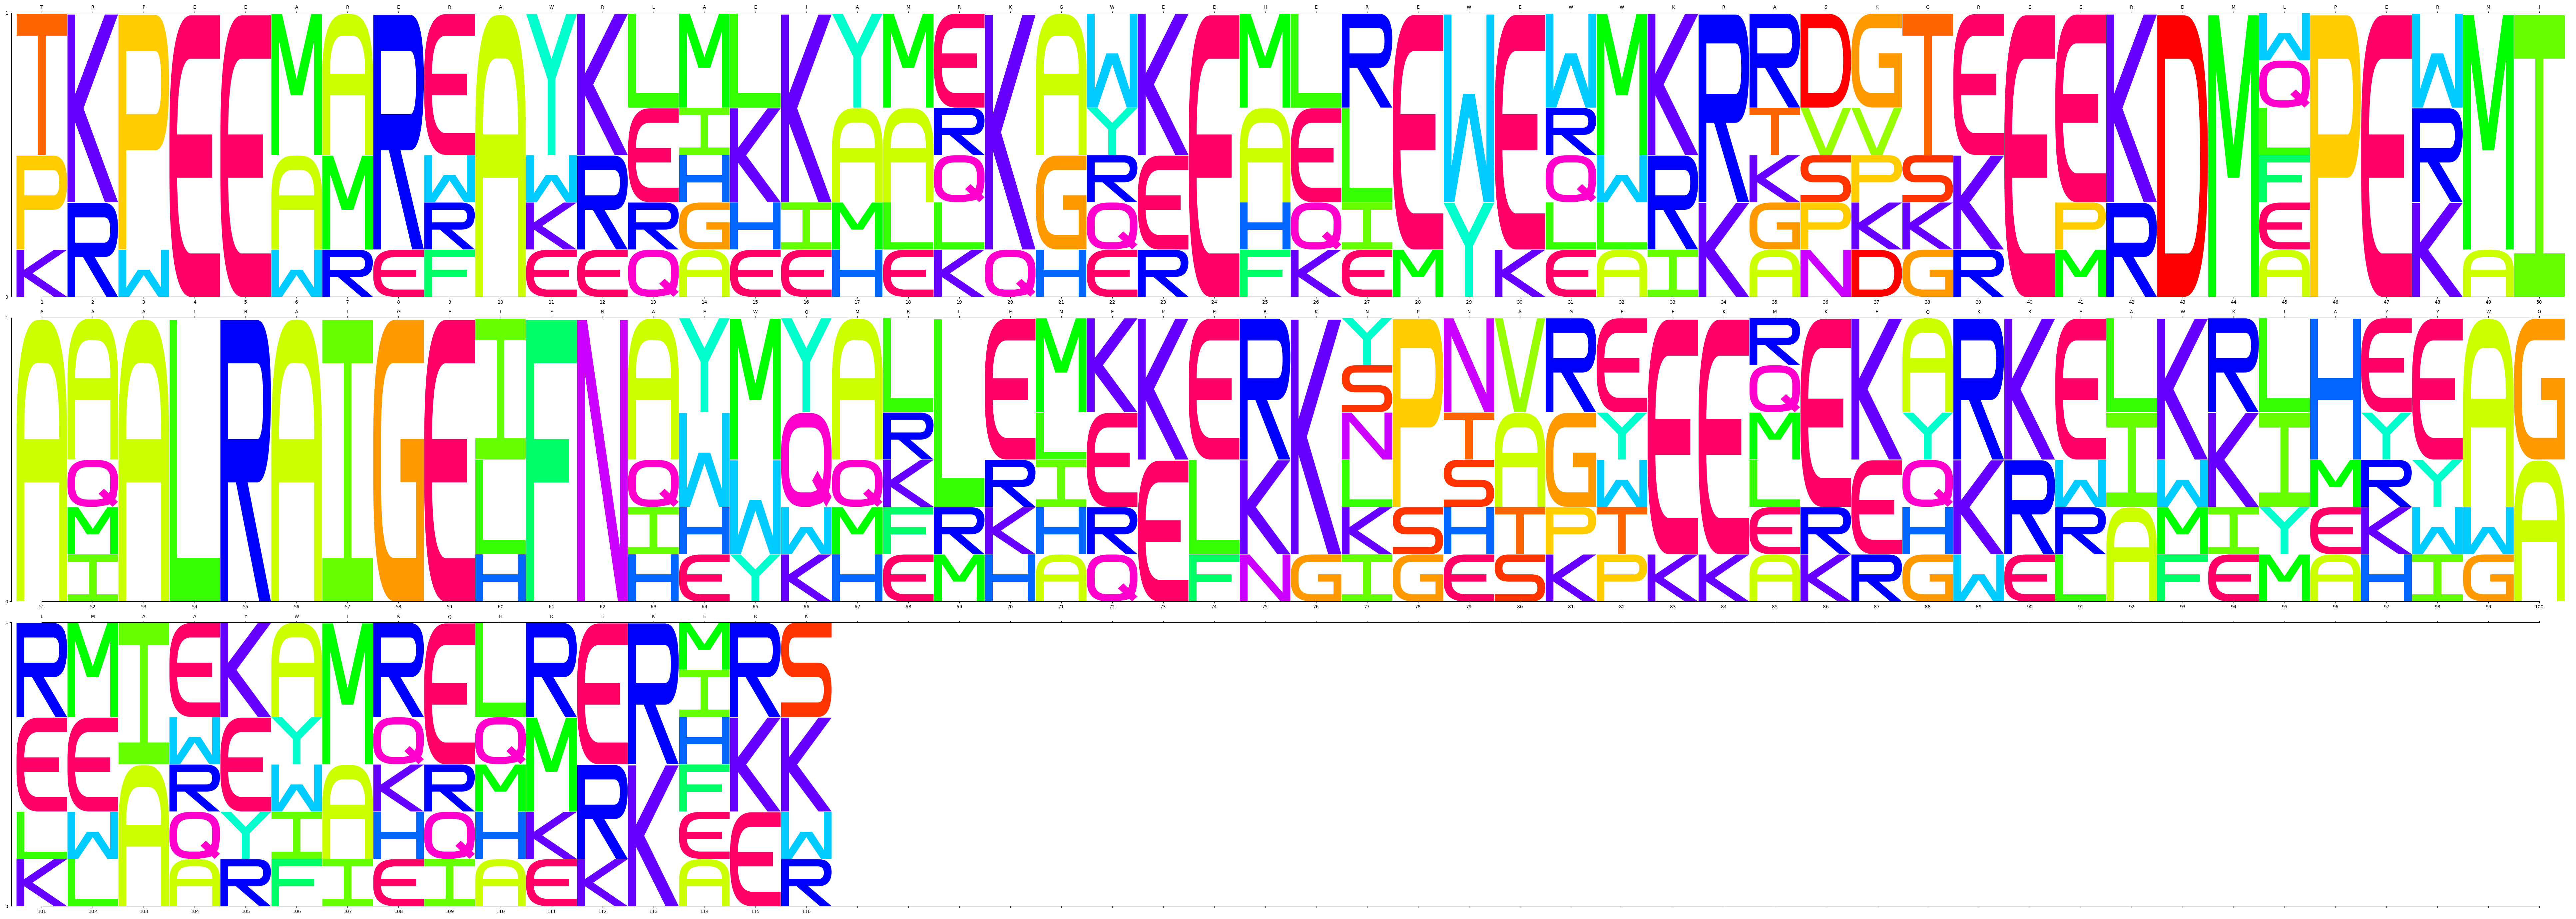
rstoolbox.plot.logo_plot(df, seqID, refseq=True, key_residues=None, line_break=None, hight_prop=4, font_size=35, refplot=False, colors='WEBLOGO')¶ Generates full figure classic LOGO plots.
Parameters: - df (Union[
DesignFrame,SequenceFrame]) – Data container. - seqID (str) – Identifier of the sequence of interest.
- refseq (bool) – if
True(default), mark the original residues according to the reference sequence. - key_residues (Residues of interest) – Residues of interest.
- line_break (int) – Force a line-change in the plot after n residues are plotted.
- hight_prop (int) – Hight proportion for each row of the plot.
- font_size (float) – Expected size of the axis font.
- refplot (bool) – When
True, it will reorder the residues in each position so that the reference residue will be on the bottom and setting a two-color scheme (provide a single color name incolors) that allows to quickly identify the reference type in each position. - colors (Union[
str,dict]) – Colors to assign; it can be the name of a available color set or a dictionary with a color for each type. Available color schemes are: Weblogo (default), Hydrophobicity, Chemistry, and Charge.
Returns: Figureandlist()of [Axes,Axes] - with primary and secondary axis of each subplot.See also
Example
In [1]: from rstoolbox.io import parse_rosetta_file
   ...: from rstoolbox.plot import logo_plot
   ...: import matplotlib.pyplot as plt
   ...: df = parse_rosetta_file("../rstoolbox/tests/data/input_2seq.minisilent.gz",
   ...:                         {"sequence": "B"})
   ...: df.add_reference_sequence("B", df.get_sequence("B")[0])
   ...: fig, axes = logo_plot(df, "B", refseq=True, line_break=50)
   ...: plt.tight_layout()
   ...:

In [2]: plt.show()

In [3]: plt.close()
- df (Union[