rstoolbox.analysis.cumulative
-
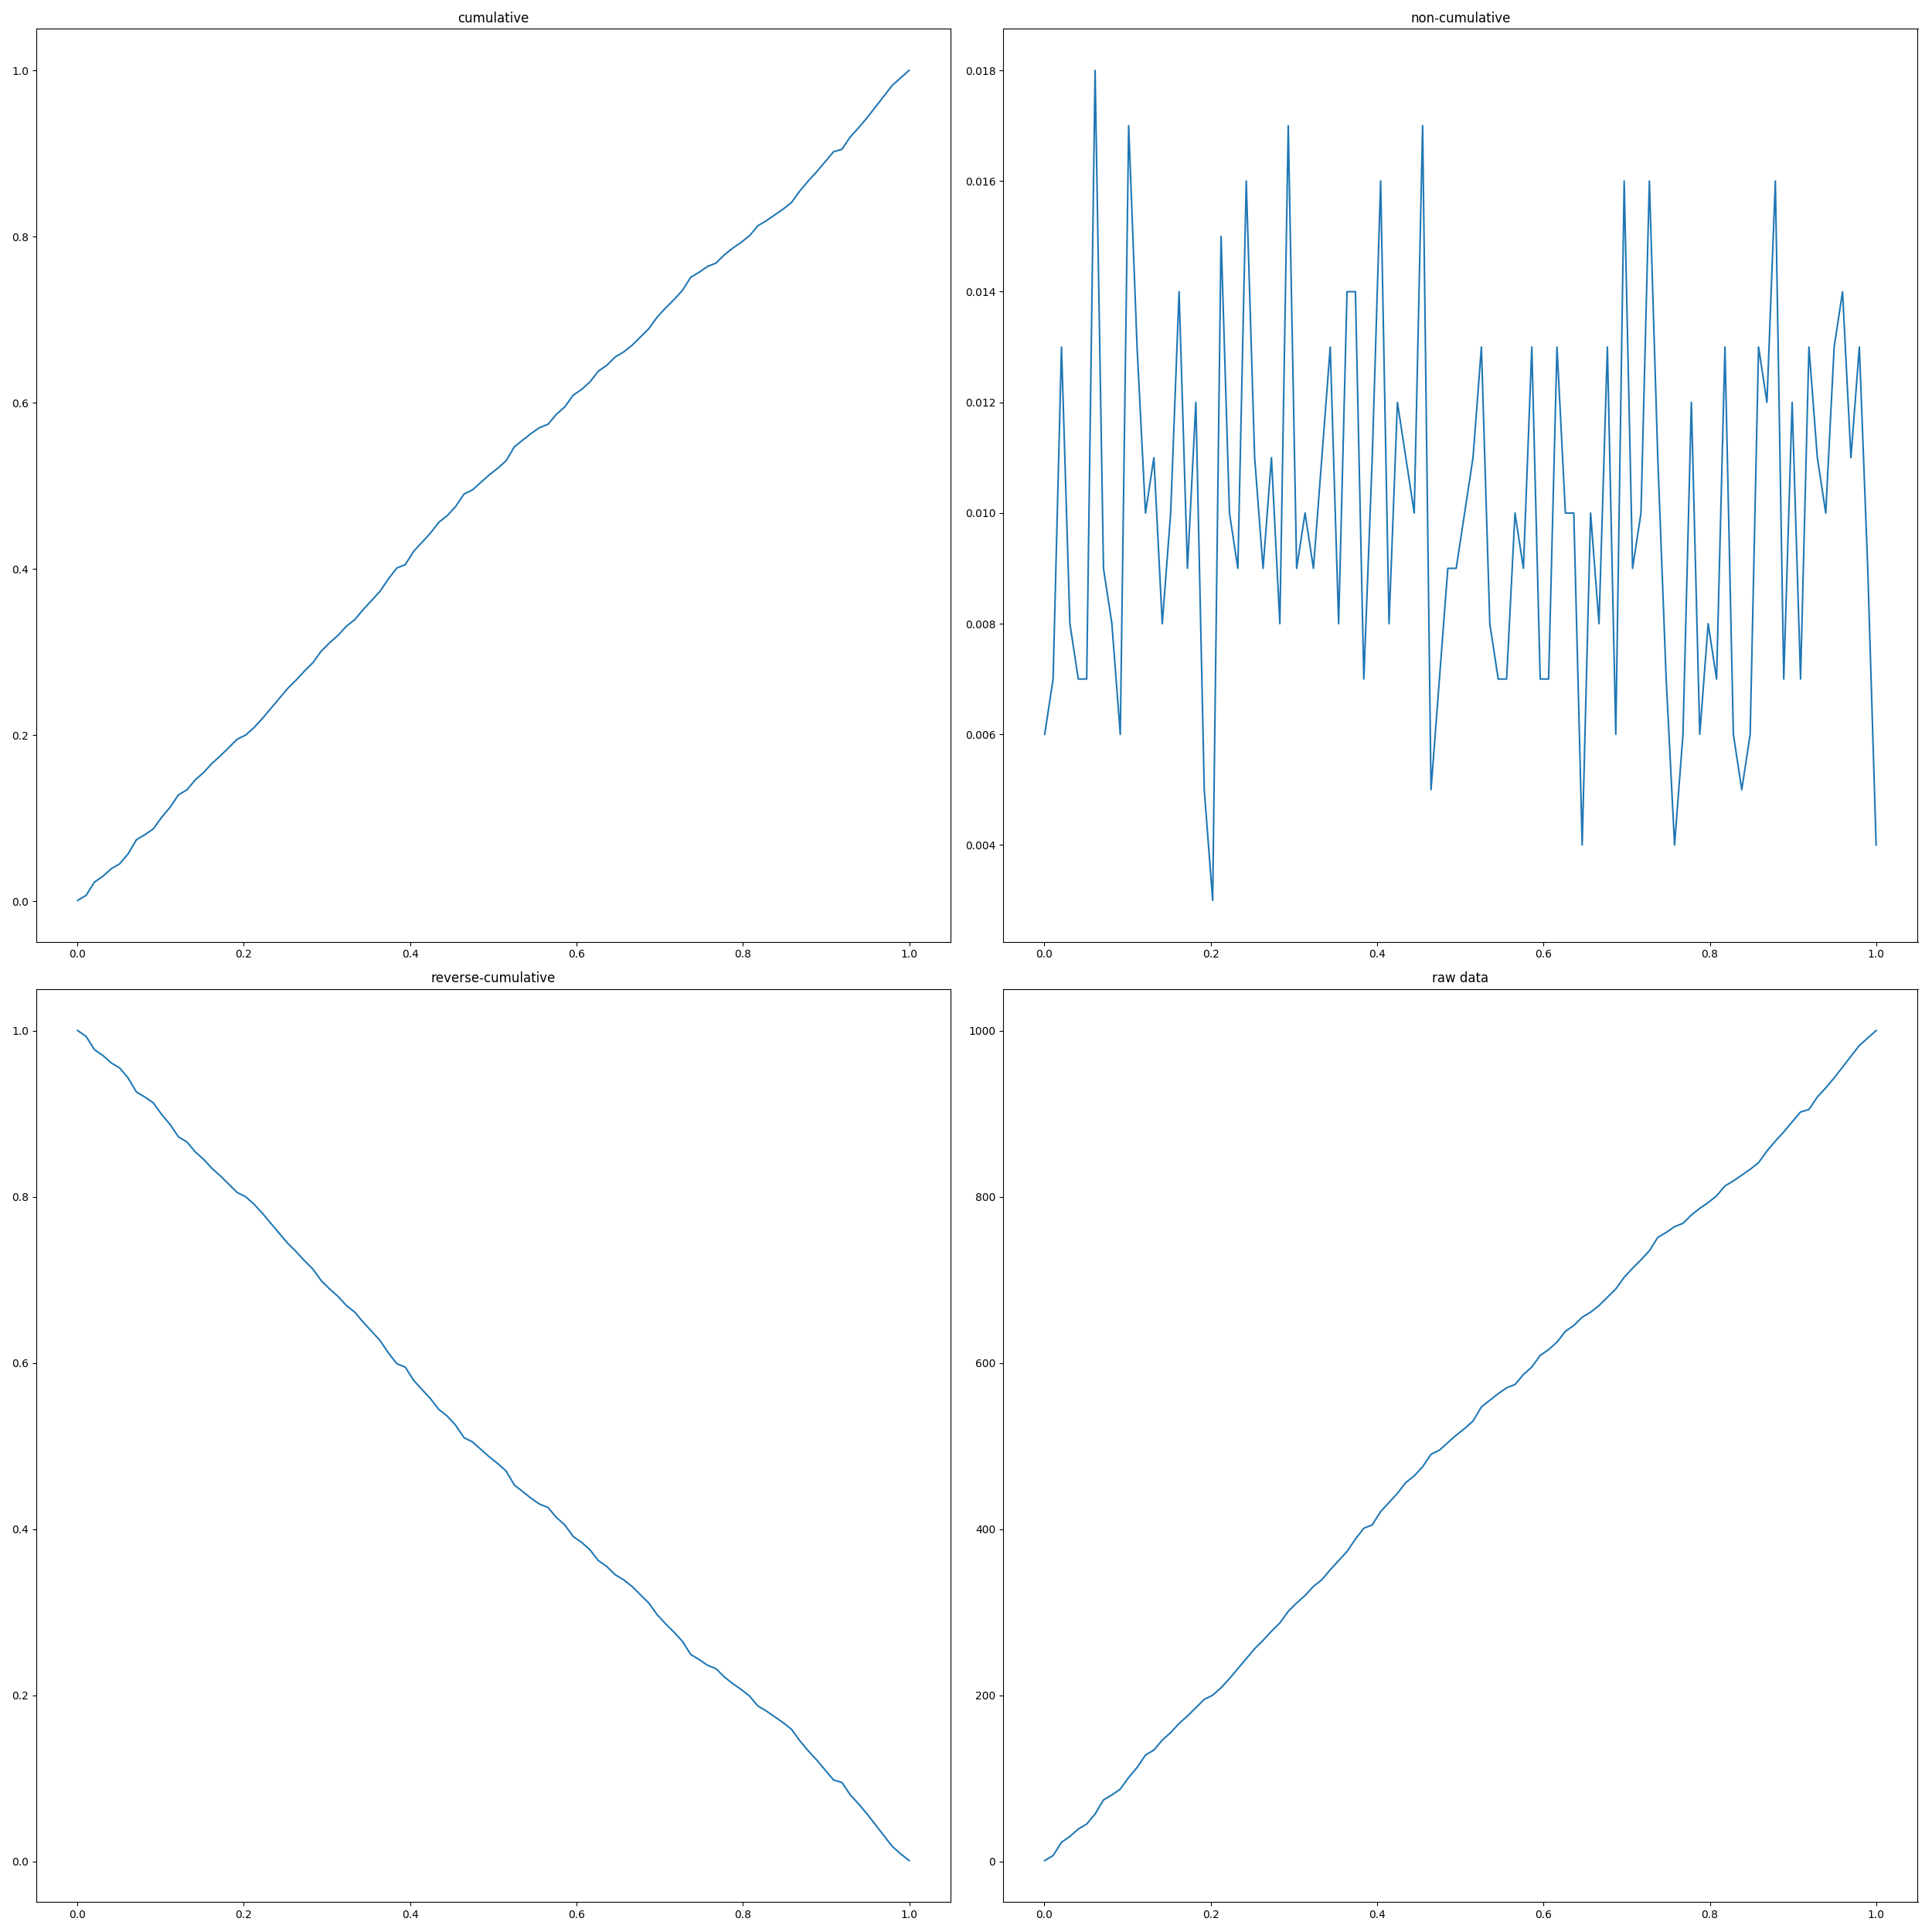
rstoolbox.analysis.cumulative(values, bins=100, max_count=None, upper_limit=None, cumulative=1)¶ Generates, for a given list of values, its cumulative distribution values.
This might be necessary in some cases when kernel estimates approximations do not accurately plot the data (specially when it alternates from very big to very small values).
Parameters: - values (Union[
list()offloat,ndarray]) – List of values to analyze. - bins (int) – Number of bins in which to split the data (~resolution).
- max_count (int) – Maximum number of counts expected. If nothing is provided, defaults to the length of values. This helps to set the values between 0 and 1.
- upper_limit (Union[
int,float]) – Max value for the bins. When not defined it is set tovalues.max(). When defined, is only taken into consideration whenvalues.max() < upper_limit. - cumulative (int) – Defines the cumulative protocol: a positive values will set up cumulative profile (default); negative values will generate an inverted cumulative profile: 0 will provide non-cumulative distributions.
Returns: [
list()offloat,list()offloat,list()offloat] - 1) the raw cumulative values, 2) precentage (0-1) cumulative values, and 3) bin positions. 2 and 3 would correspond to the y, x values of the plot.Example
In [1]: from rstoolbox.analysis import cumulative
   ...: import numpy as np
   ...: import matplotlib.pyplot as plt
   ...: np.random.seed(0)
   ...: data = np.random.rand(1000)
   ...: fig = plt.figure(figsize=(25, 25))
   ...: ax00 = plt.subplot2grid((2, 2), (0, 0), fig=fig)
   ...: ax01 = plt.subplot2grid((2, 2), (0, 1), fig=fig)
   ...: ax10 = plt.subplot2grid((2, 2), (1, 0), fig=fig)
   ...: ax11 = plt.subplot2grid((2, 2), (1, 1), fig=fig)
   ...: raw, y, x = cumulative(data)
   ...: ax00.plot(x, y)
   ...: ax00.set_title('cumulative')
   ...: raw, y, x = cumulative(data, cumulative=0)
   ...: ax01.plot(x, y)
   ...: ax01.set_title('non-cumulative')
   ...: raw, y, x = cumulative(data, cumulative=-1)
   ...: ax10.plot(x, y)
   ...: ax10.set_title('reverse-cumulative')
   ...: raw, y, x = cumulative(data)
   ...: ax11.plot(x, raw)
   ...: ax11.set_title('raw data')
   ...: plt.tight_layout()
   ...:

In [2]: fig.show()

In [3]: plt.close()
- values (Union[